
Prospective Student Parent Engagement
TOTAL CONVICTION: EPISODE 1
Prospective Student Parent Engagement
When it comes to making a college decision, the influencers that truly matter can’t be found on a student’s Instagram feed, but rather, around the kitchen table. That’s right, as our College Bound Student Survey has proven year after year, a student’s family has the most sway over a student’s decision about a school. With that in mind, it only makes sense to make sure parents of prospective students fully understand the opportunities available for their students at your college or university.
In the first installment of our new video series, “Total Conviction,” Spark451 CEO Steve Kerge spends a few minutes discussing the importance of engaging with parents of prospective students, and he even offers a few tips for doing so successfully. Check it out now:
When you’re ready to discuss parent engagement strategies for your institution, please reach out. Our team of enrollment marketing experts will be happy to help you develop a budget-friendly plan that will move the needle.
You can also revisit the full collection of “Total Conviction” videos here!
2021 College-Bound Student Survey: Download The Report
Month: October 2021
You already know that the college admissions world has been working through some unique challenges in the last couple of years (to say the least). However, you’ll probably still be surprised by some of the findings from Spark451’s latest College-Bound Student Survey. For example, in spite of all the hype in the media, just about half of students who responded to our survey said that an institution’s COVID vaccine requirements had NO impact on their enrollment decisions.
This summer, thousands of 2021 high school graduates responded to the Spark451 Education Research Division’s 10th annual survey on the college selection process. Download the full report to gain access to all the valuable information for college admissions professionals, including:
- The Class of 2025’s social media habits
- Students’ reactions to test-optional admissions policies
- The effect of fee waivers on application decisions
- How students feel about text messages from schools
Download the report now. Then, reach out. We’ll be happy to help you determine if your upcoming admissions marketing and student search plans are fully in line with the latest data from students.

May the (GA4) Force Be With You
Month: October 2021
Google Analytics (GA) released its most recent update, Google Analytics 4 (GA4), and has introduced some enhancements that are quite useful to us as higher education marketers. First, we think it’s important for you to understand what GA is for—understanding your website traffic and using the data to make informed decisions in your marketing plans. For example, GA tracks how many unique visitors land on a website, whether they arrived at that site organically or through a paid ad source, where visitors are coming from geographically, the time of day they’re landing on the site, and day of the week. We use these details to drill down to incredible detail and find commonalities and trends which can further inform us how to wisely spend marketing dollars and maximize ROI.
With this in mind, we can now answer this core question: How does the rollout of the improved GA4 differ from what was available in the previous iteration of the tracking tool (formerly called Universal Analytics, or UA)?
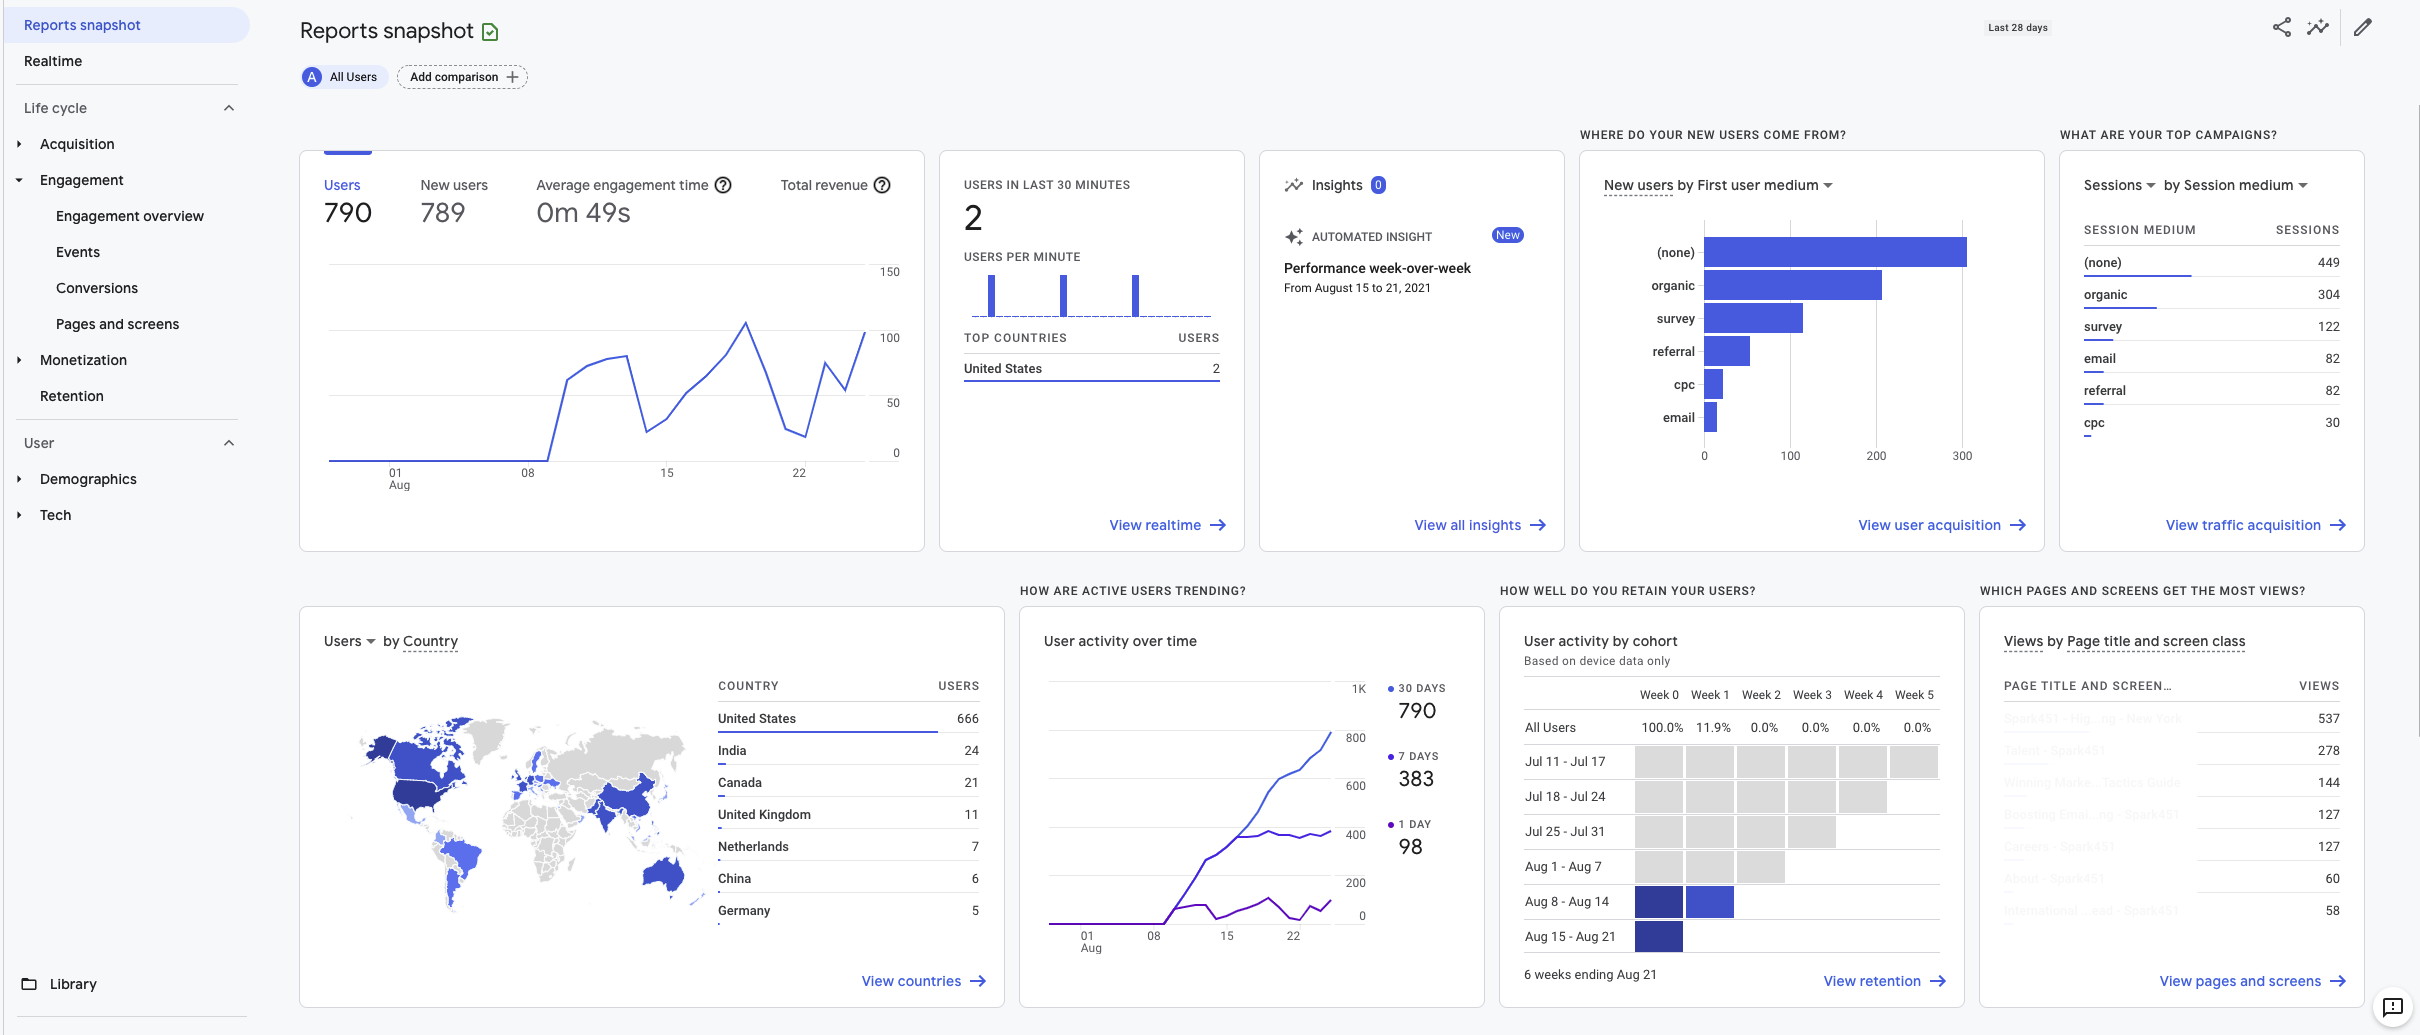
A Hub for Analysis
While the GA4 interface may seem complex and overwhelming at first, it has become a powerhouse of a tool that requires much less manual work to get your analytics off the ground. Its increased automation gives you hours back to your day and allows you to use its pre-built components to start connecting your data and reporting it in one fluid stream.
You can slice and dice your data however you need to showcase it, because GA4 has the pre-built templates you want to get your data analysis started. It also has the customization options to allow you to start dreaming big. The Analysis Hub is where you’ll find a variety of reports to start out with. For example, GA4 includes a custom report for “Funnel Exploration,” which enables you to see a user’s interaction with steps they took before submitting an inquiry form or starting an application. “Path Exploration” is another report that will show you a user’s pathway through your website; where did they come from, and what path did they take to peruse your website?
“Free-form” and “Cohort Analysis” reports will help you answer other important questions, such as:
- What types of visitors are coming to your site—traditional high school students, adult degree completers, or graduate prospects?
- What pages are users looking at before taking an action?
- Is there a common thread in the customer journey between landing on your homepage to submitting an app?
You can start to answer all of these questions with the report customization options within GA4.
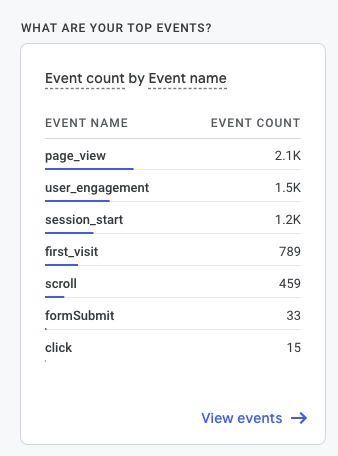
Enter “Events”; More Than Page Views
Universal Analytics (the prior version of GA) tracked user sessions during a website visit, accruing session-based data from a user’s time on a webpage, and it reported these actions back as “hits” on your website. GA4 takes these “session-based hits” and ups the ante by providing a fuller picture of what users are taking action on, with the use of “events” for each step they take. Now, each action taken on your website is tracked as an event. GA4’s default tracking events include click, scroll, file downloads, video start, and video complete. Ultimately, these advanced metrics will be the key in uncovering behavioral patterns to inform your content strategy and marketing tactics.
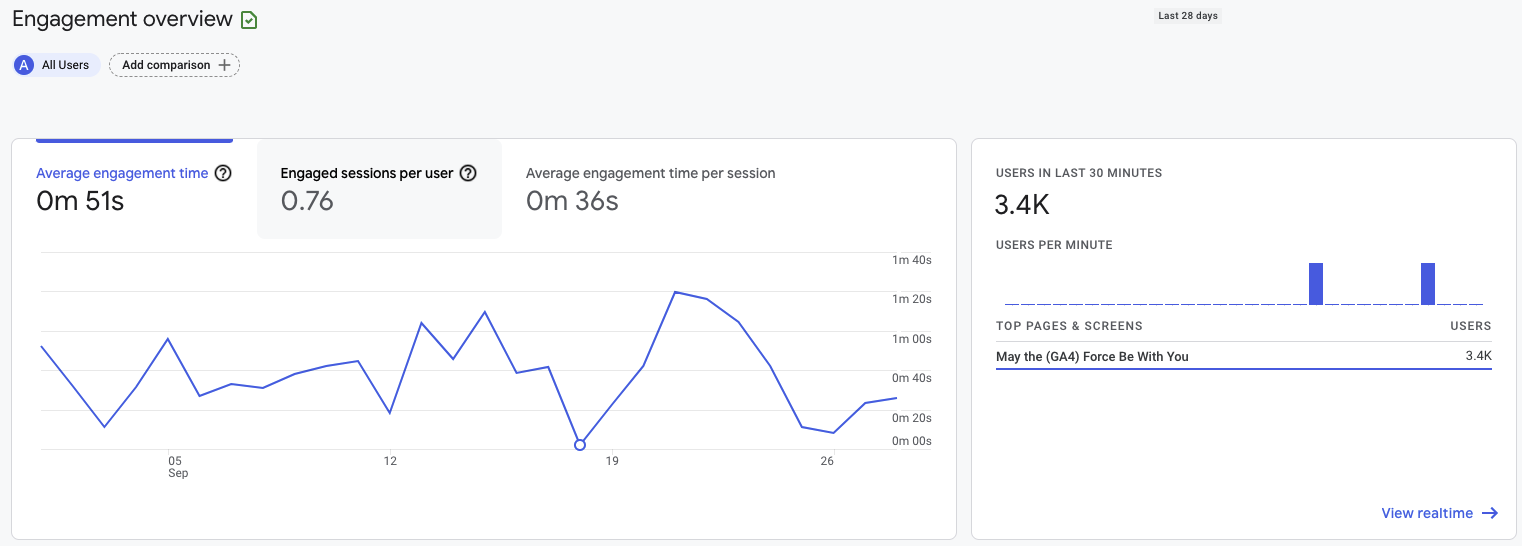
Say Goodbye to Bounce Rate
Bounce rate, the trusty, yet one-sided metric that tracked the number of visitors who navigated away from your website, has made its own exit from the new Analytics. Replacing it is “engagement rate,” a more useful measure of time spent on your site. Unlike bounce rate, this new metric doesn’t just show you how many users leave your site, but it dives deeper, considering one or more actions, such as being active on the website for 10 or more seconds, engaging in two or more page views, and/or a conversion event firing. This is a favorable update if you’re looking to squeeze out as much information about the user experience on your website as possible, since it exposes more than just the fact that some users leave, or bounce. Now, you can look at how they enter the site and better understand whether your website content is engaging for your targeted audiences.
Now that Google Analytics has upped its game, it’s time to leverage this tool as your (not-so) secret weapon to evaluate your website’s strengths and challenges. Having so much analytical power at your fingertips can be overwhelming as you start to explore the tool (it does, after all, have a completely new look), but it will be worth all of your marketing dollars to invest the time to learn the tool’s insights for your institution’s website. If you don’t know where to begin, we can help you get started. Reach out to learn more about how we can help you leverage the force behind GA4.