In December 2021, Spark451 marked a major milestone—the celebration of our 10-year anniversary! As we reflect on the past decade, we are overwhelmed with feelings of warmth and gratitude for all of the support and collaboration among our team, partner schools, friends, and family.
Since our agency began, the Spark451 team has proudly delivered strategy, creativity, analytics, innovation, and most relevant to this blog post, original research. For example, in 2013, we began producing an annual research project, “The College-Bound Student Survey.” We have conducted this survey for more than nine years, and over that time, we have collected input from more than 40,000 college-bound students from all parts of the country. Their feedback spans topics including social media and technology habits, application activity, enrollment considerations, and more.
Before we turn the page and embark on our second decade, we thought it would be both fun and interesting to review all of our College-Bound Student Surveys to date and show you how certain things have evolved (or not). We’ve selected 10 questions that we have asked in multiple annual surveys in order to illustrate how students’ answers have trended over time.
We hope you enjoy this brief dive into students’ mindsets over the past several years.
10. Utilizing Social Media for College Search and Selection
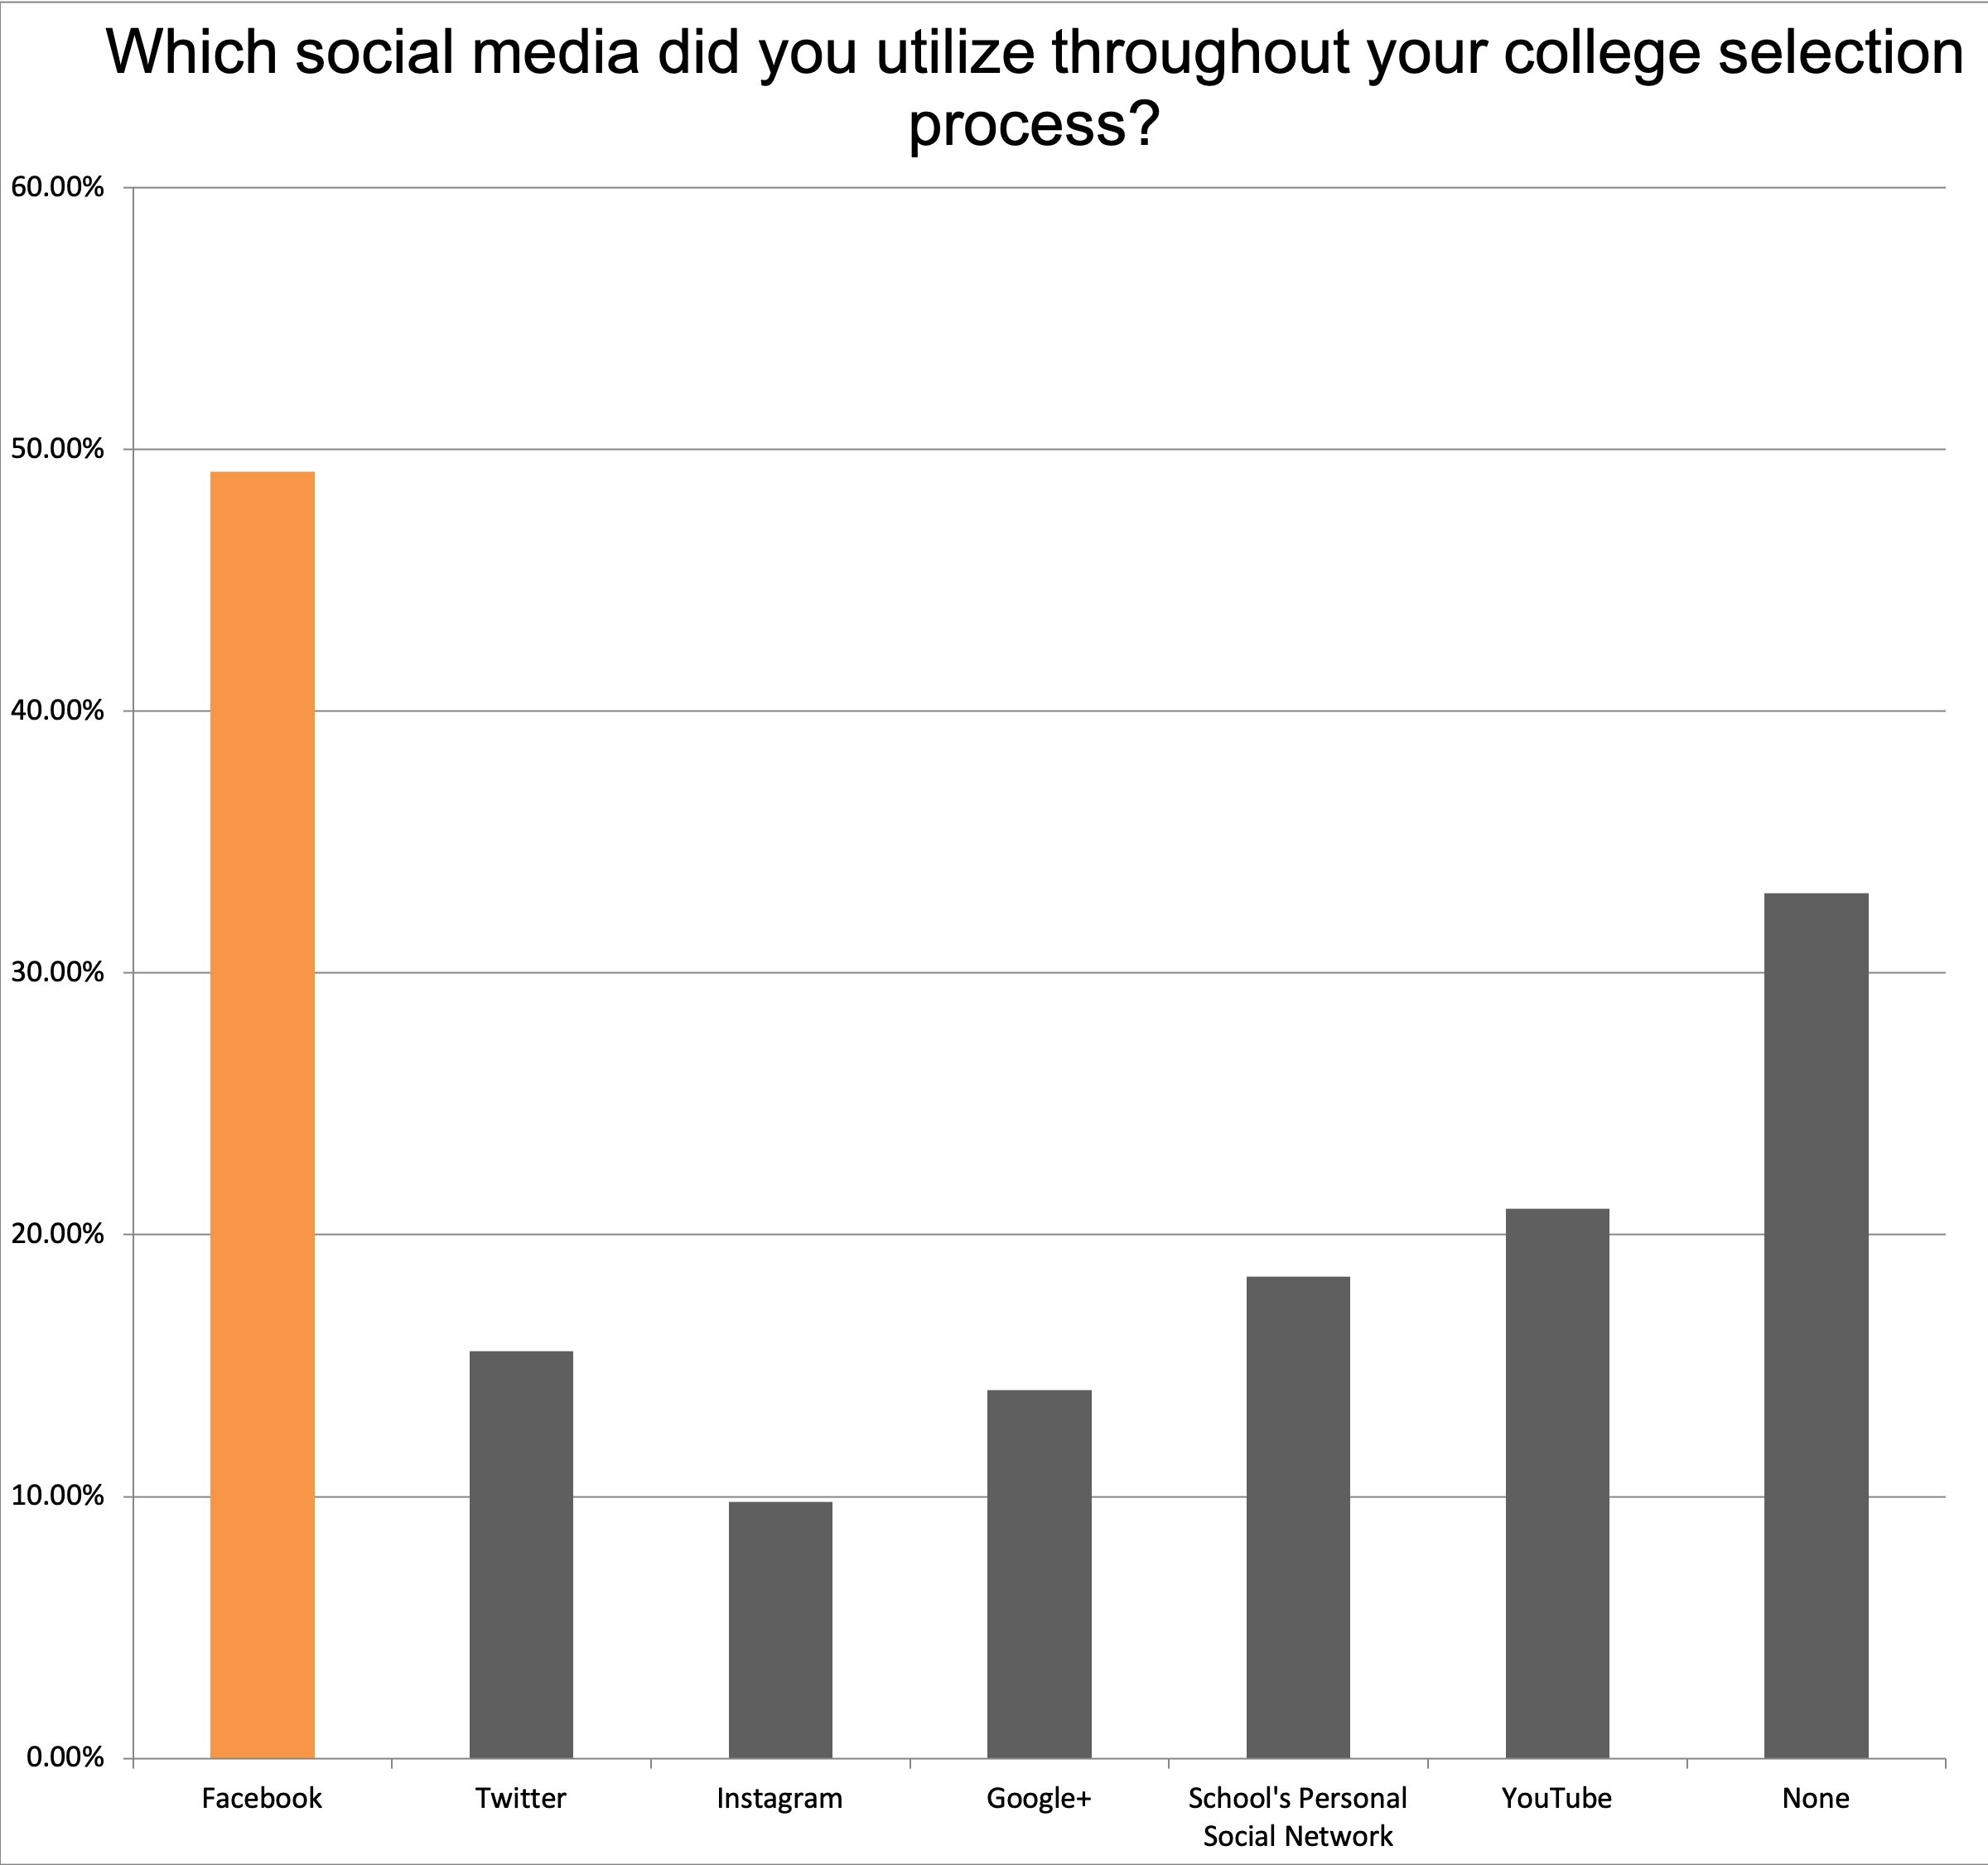
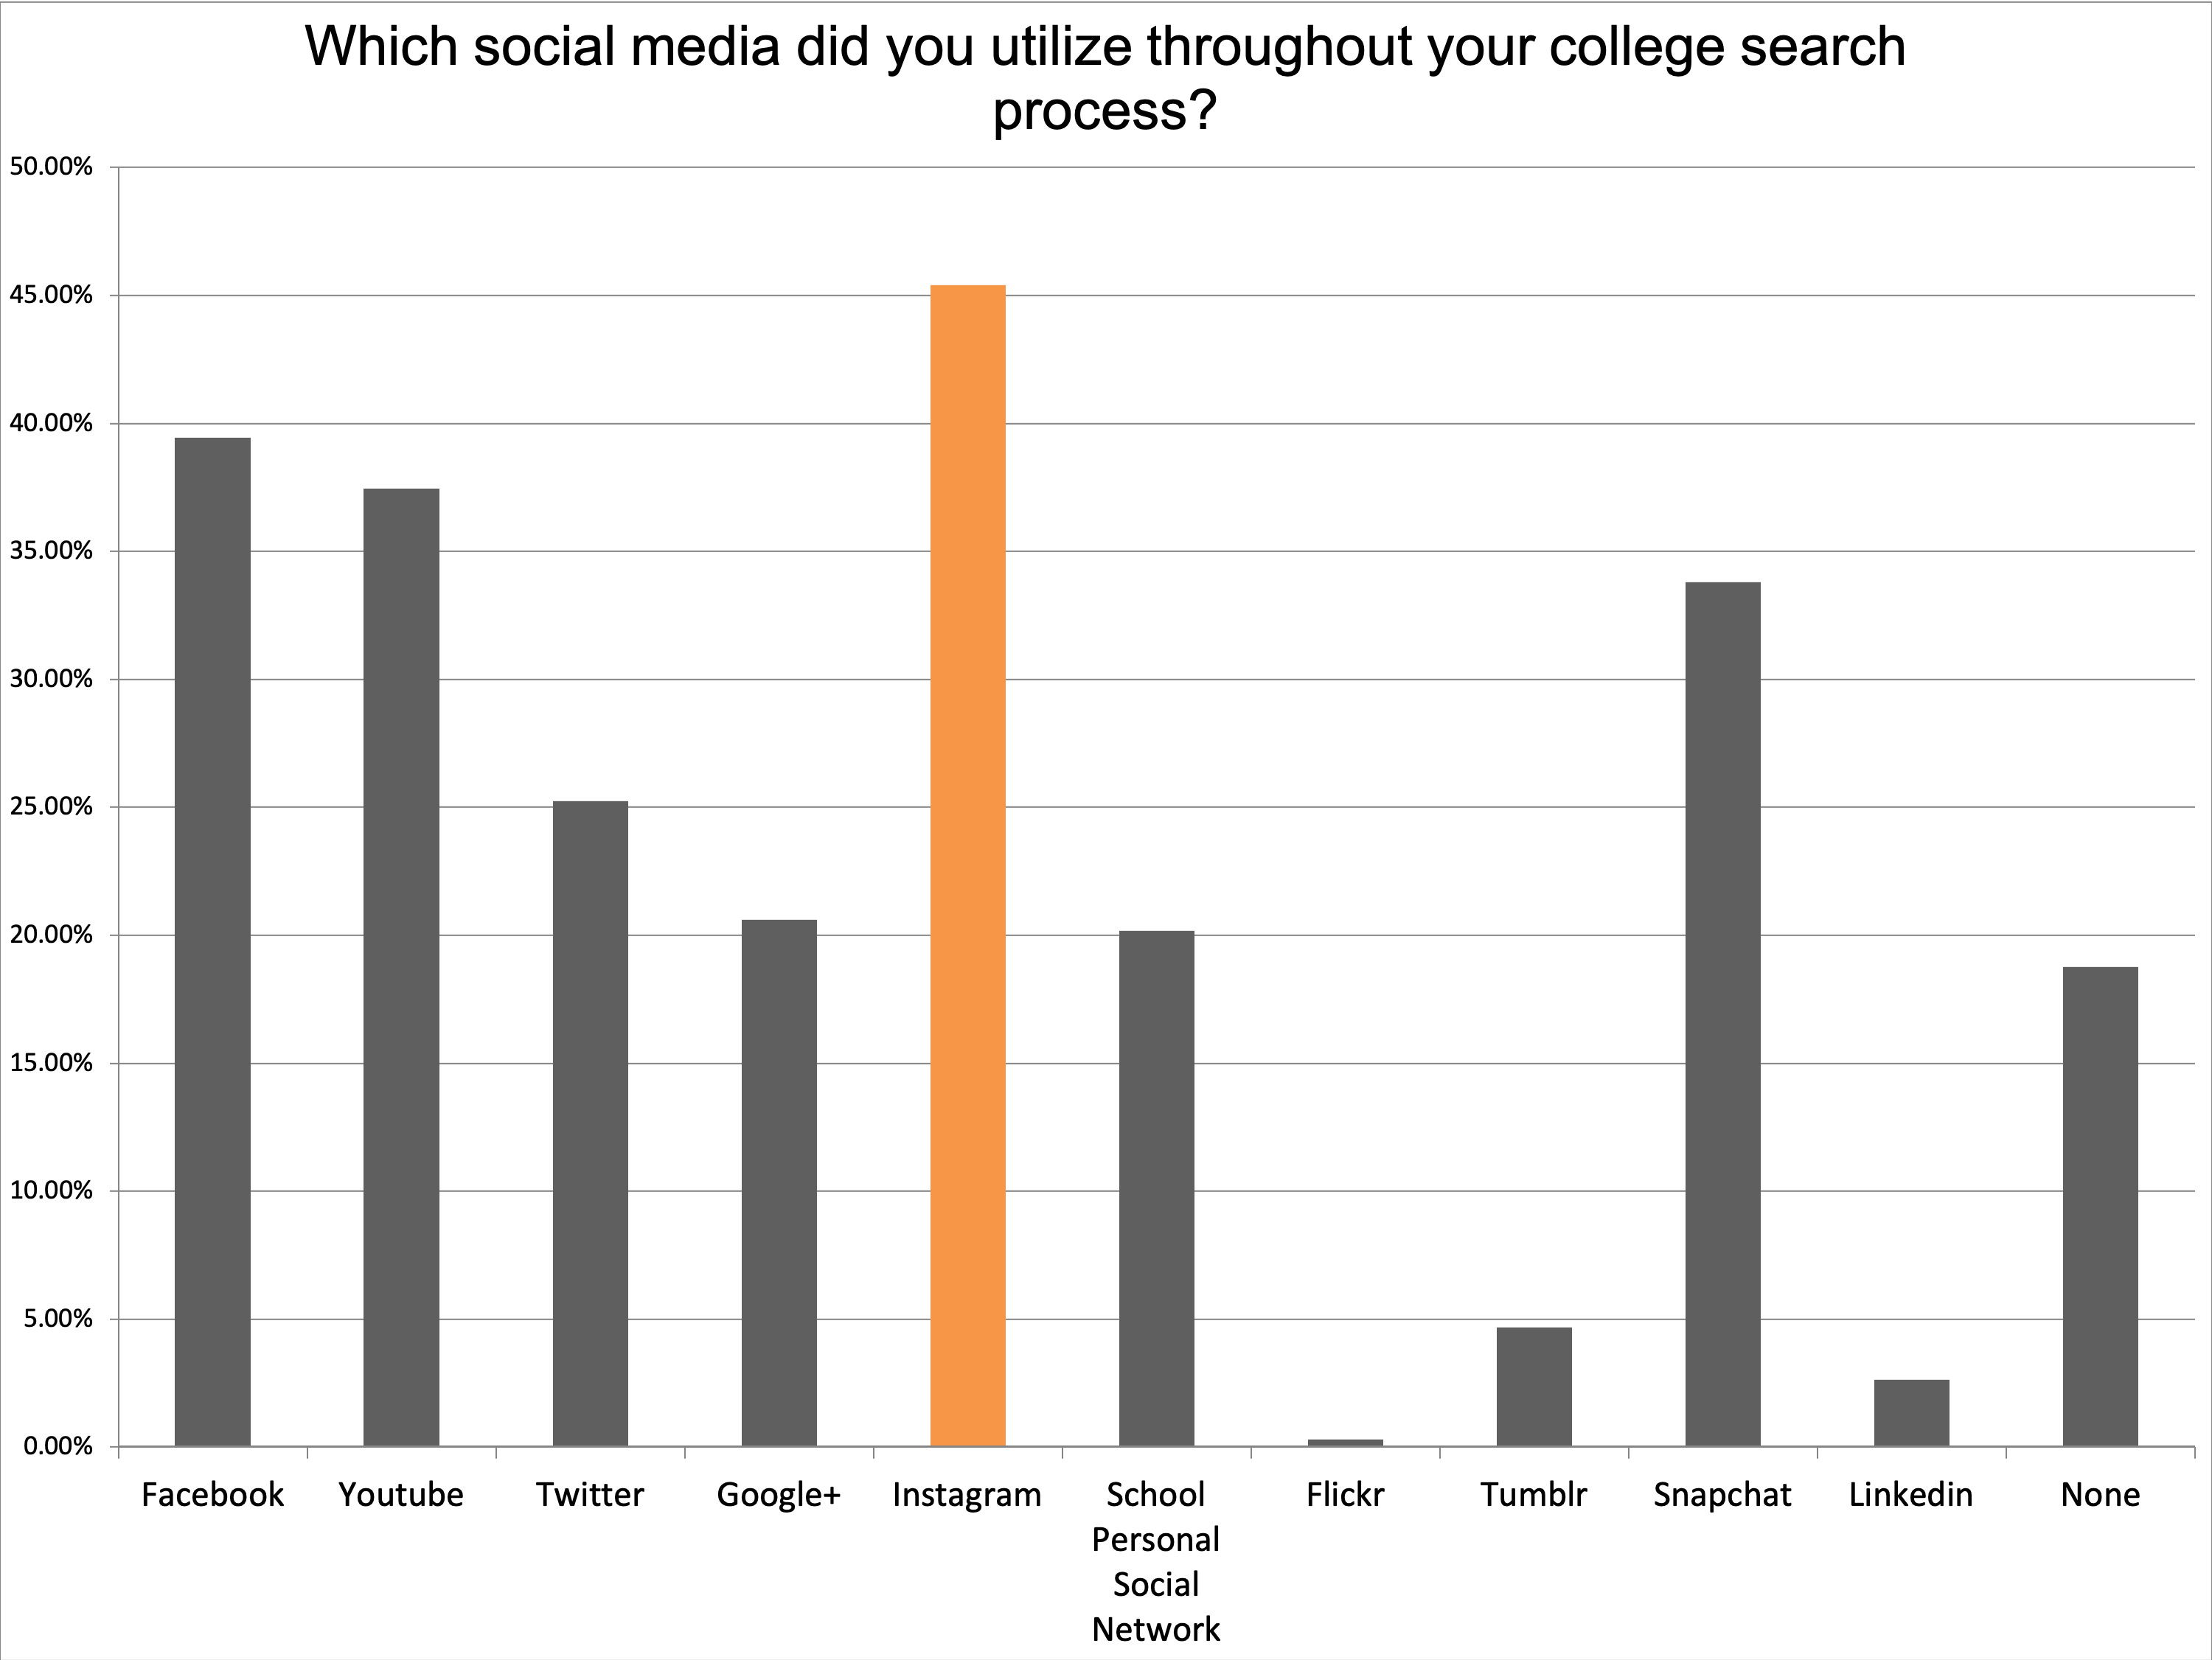
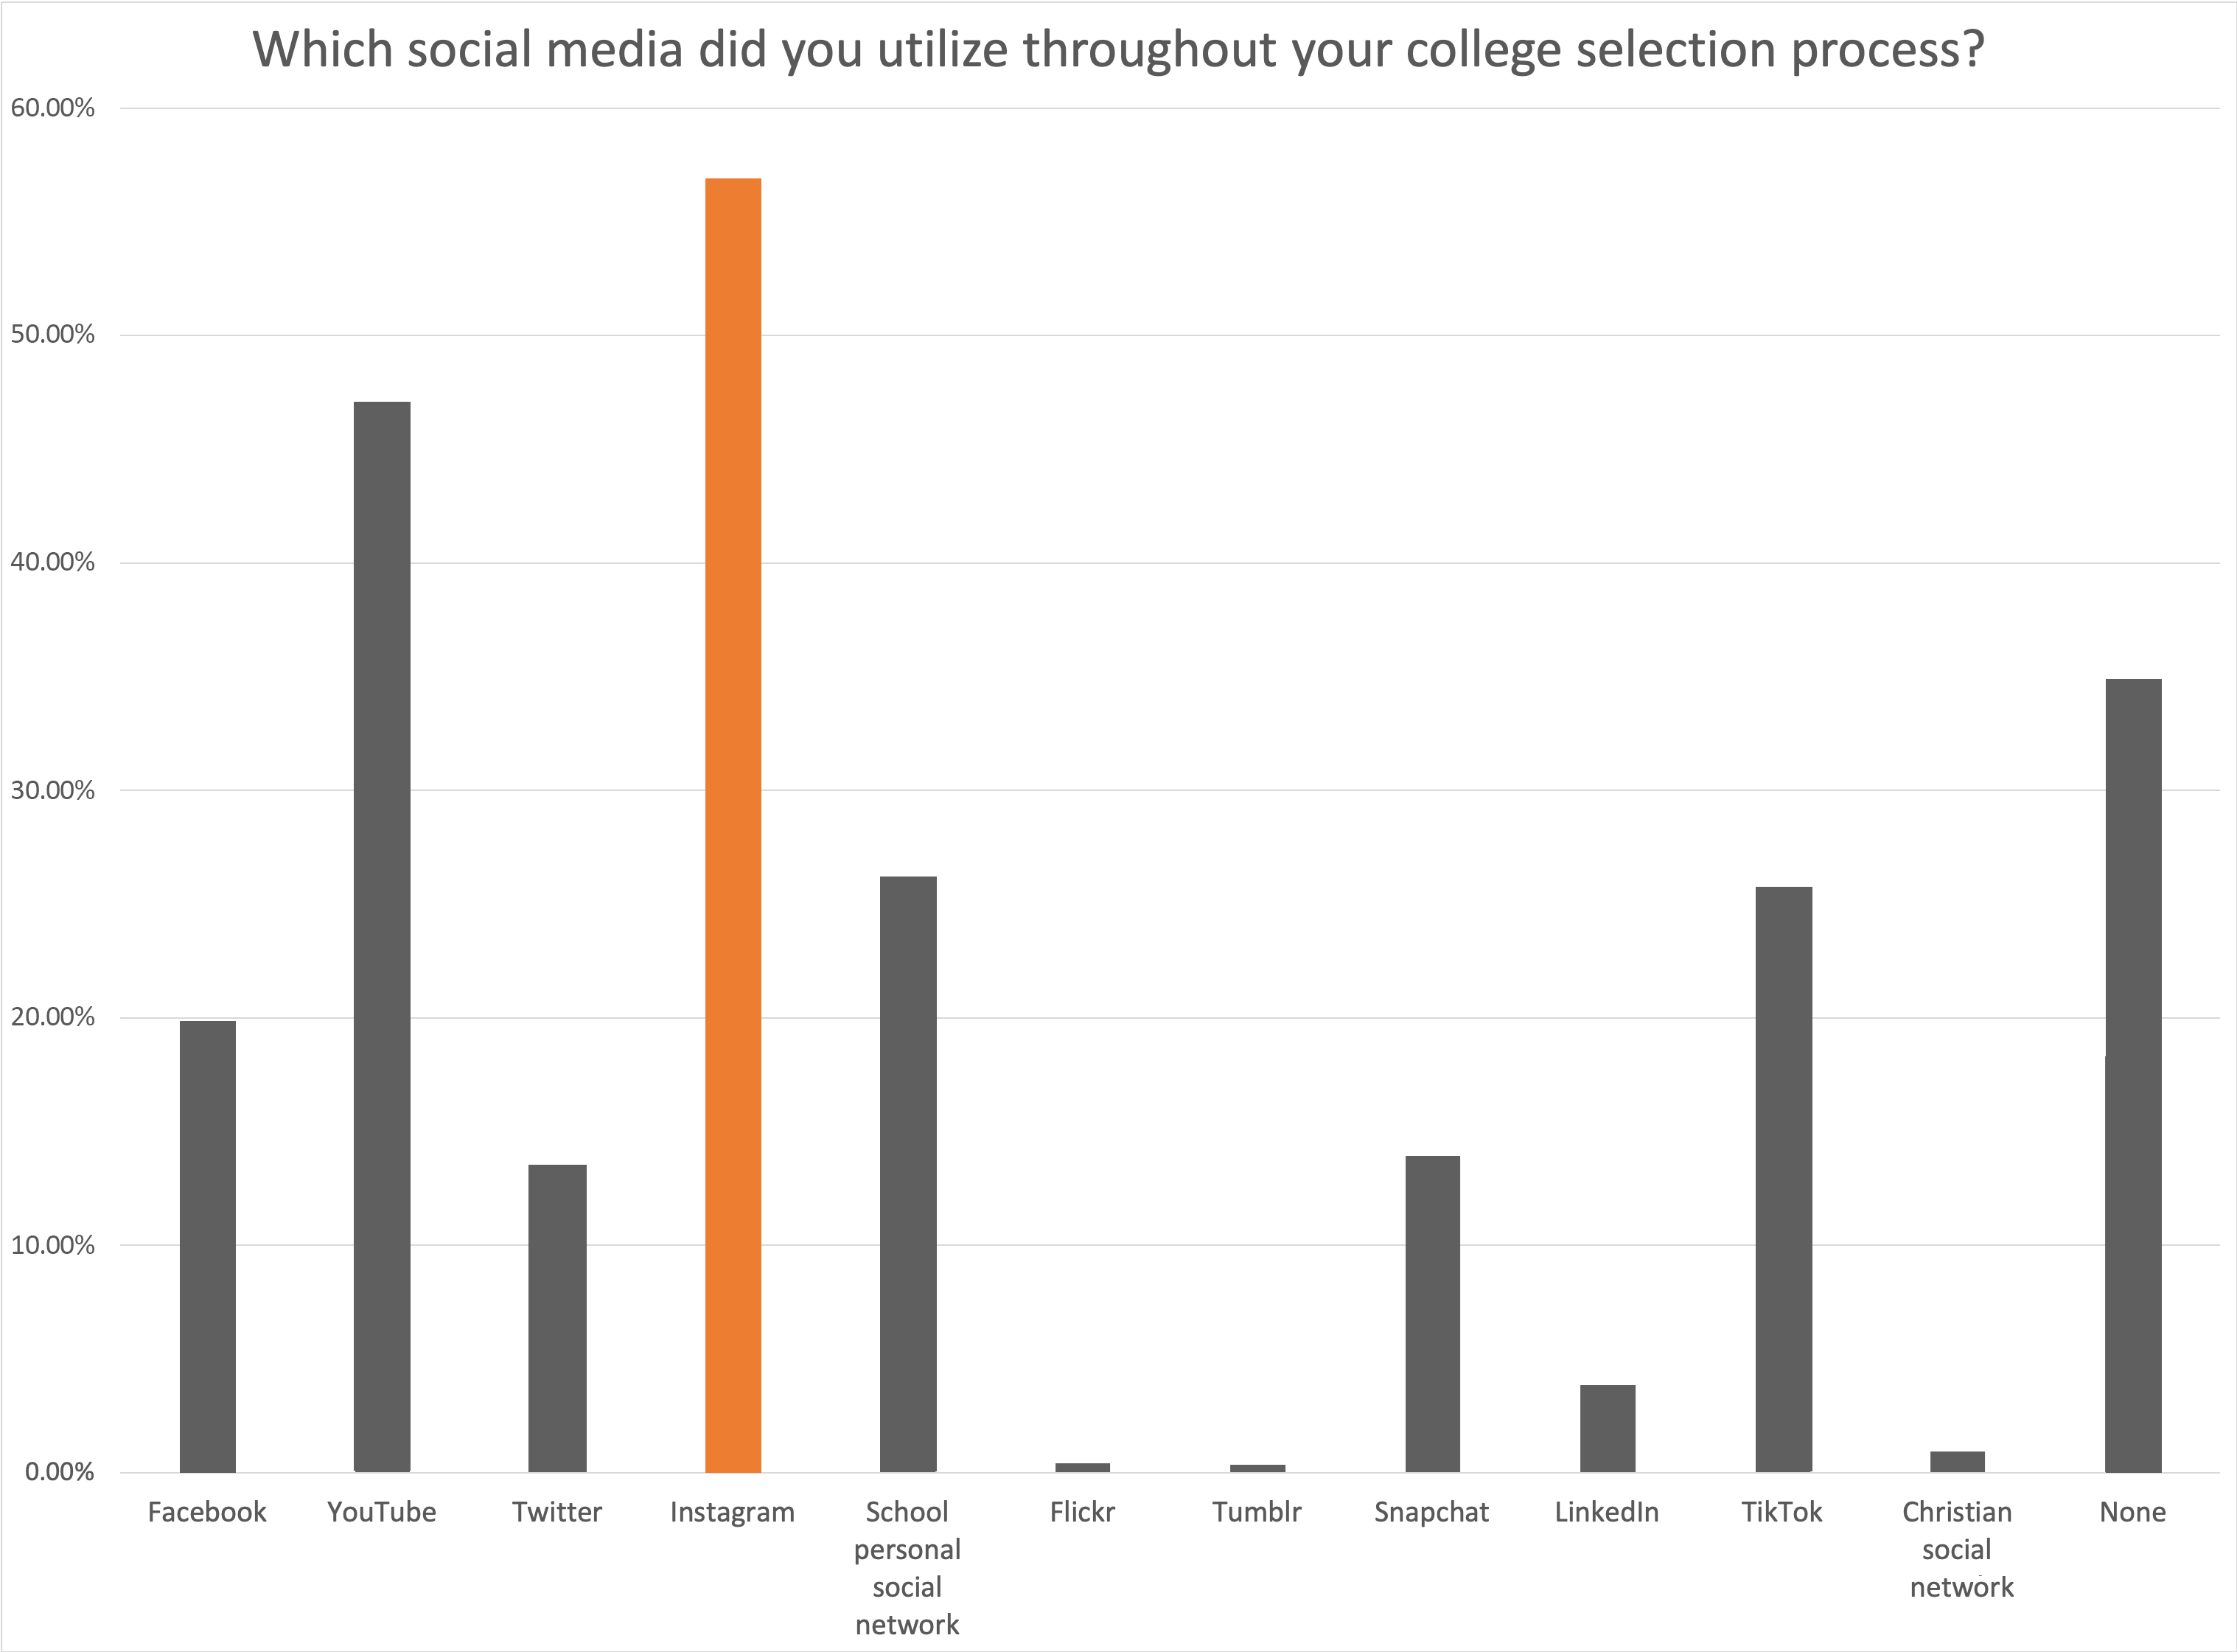
It’s amazing to see how students’ social media habits have evolved in such a short amount of time. In 2013, we introduced the question, “Which social media did you utilize throughout your college selection process?” We continue to ask this same question today. Here’s a glimpse of how that answer has evolved in the past decade:
In 2013, Facebook dominated, while names like Snapchat and TikTok didn't even exist
Click images to enlarge
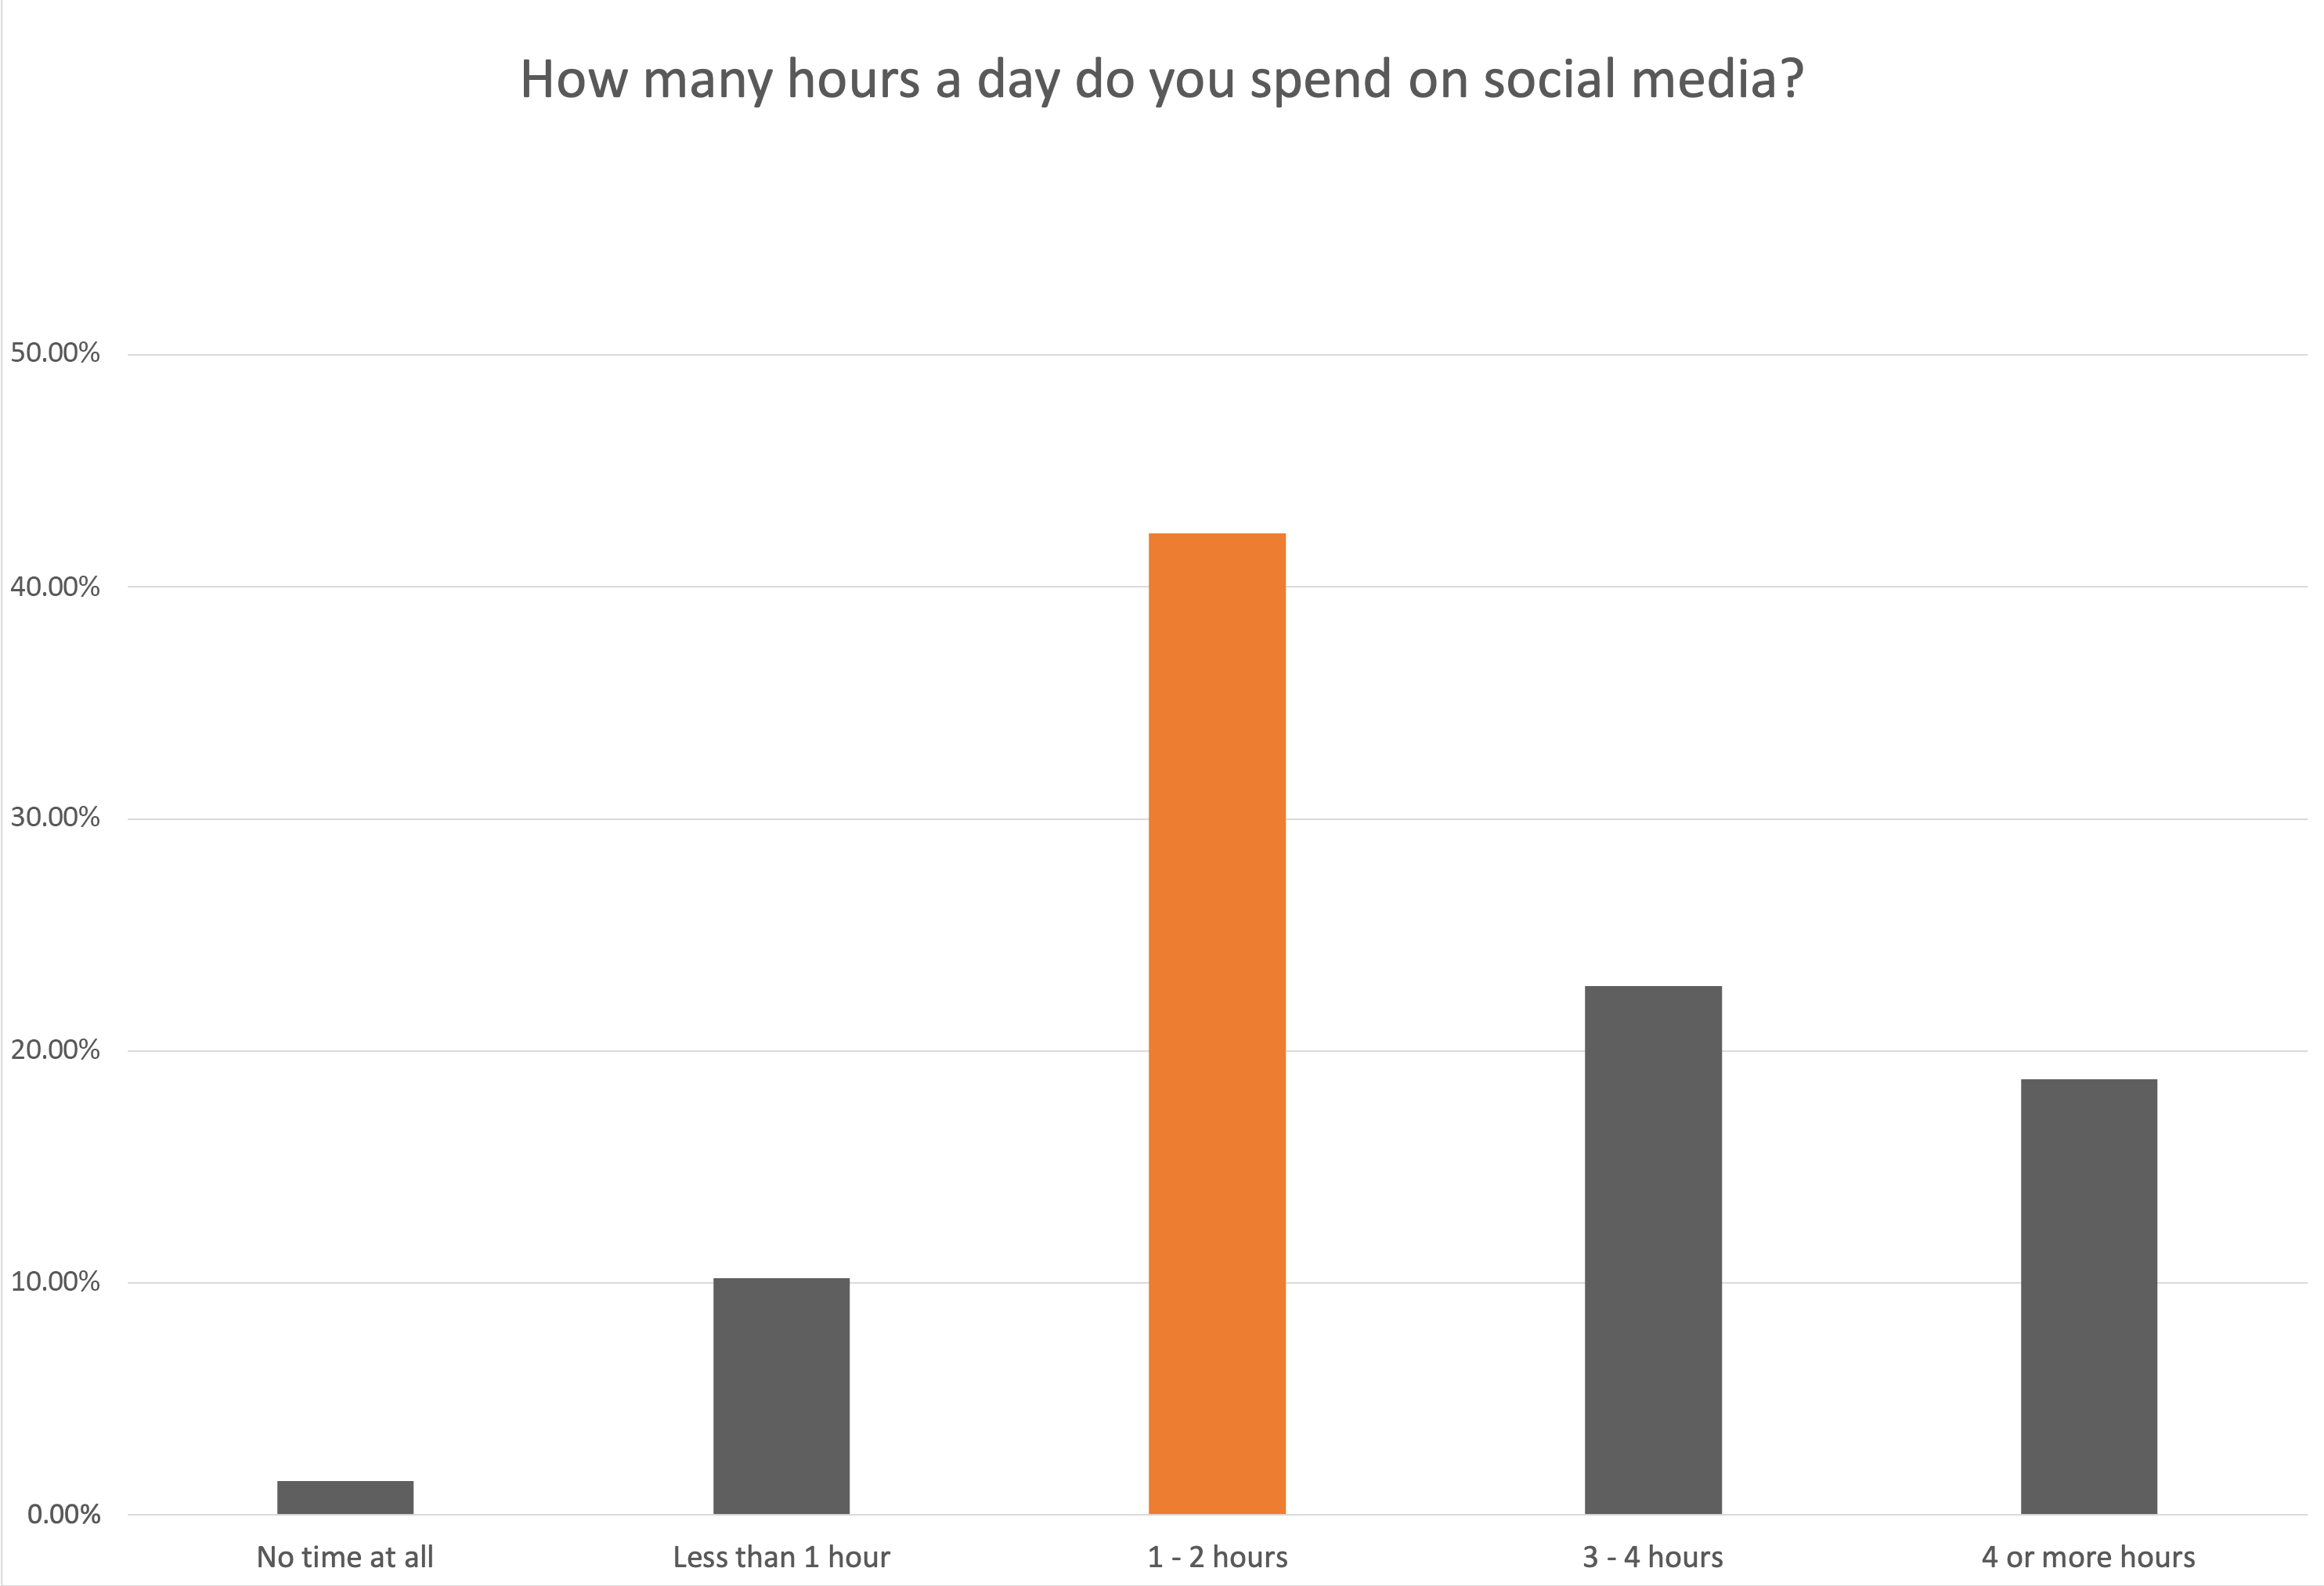
9. Time Per Day Spent on Social Media
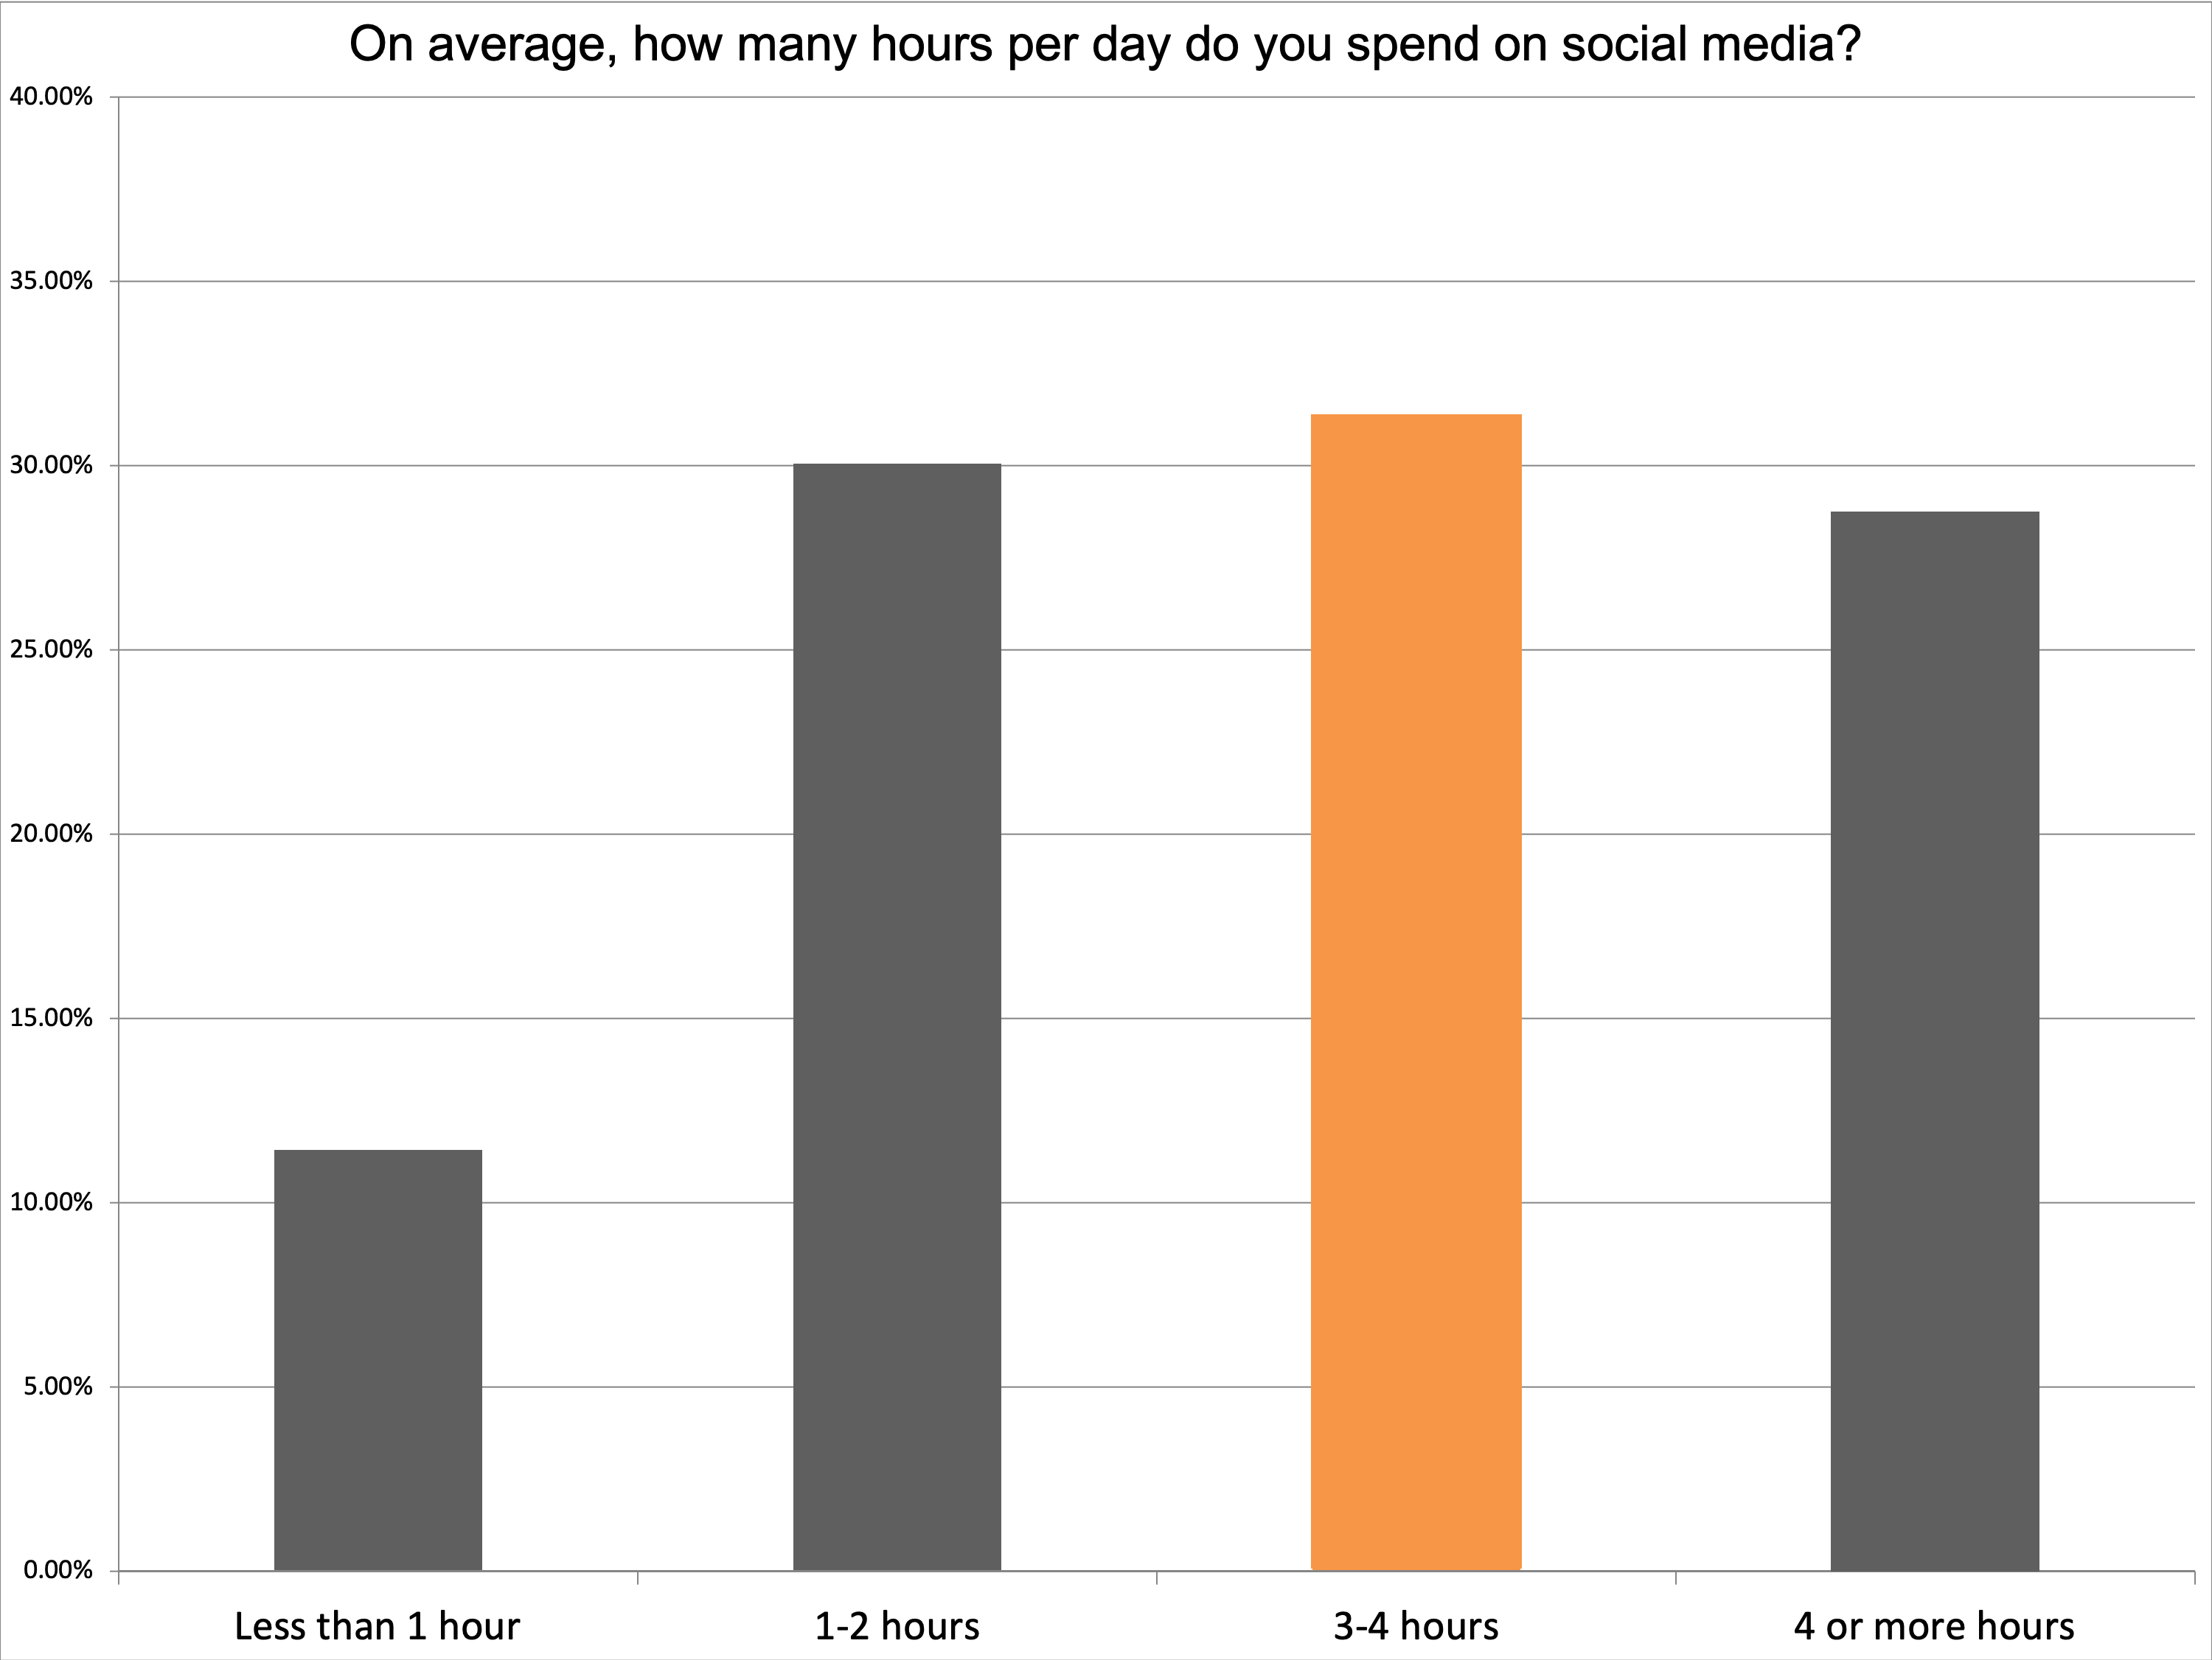
In 2016, Spark451 began tracking the average time students spend per day on social media. The amount of time has actually decreased pretty dramatically in the last five years. In 2016, the highest ranked answer was 3–4 hours, while in 2021, the dominant answer, by far, was 1–2 hours.
This statistic is particularly interesting, as many of us would jump to the conclusion that COVID-19 has increased a high schooler's social media time. However, the data we have collected does not support that notion.
Click images to enlarge
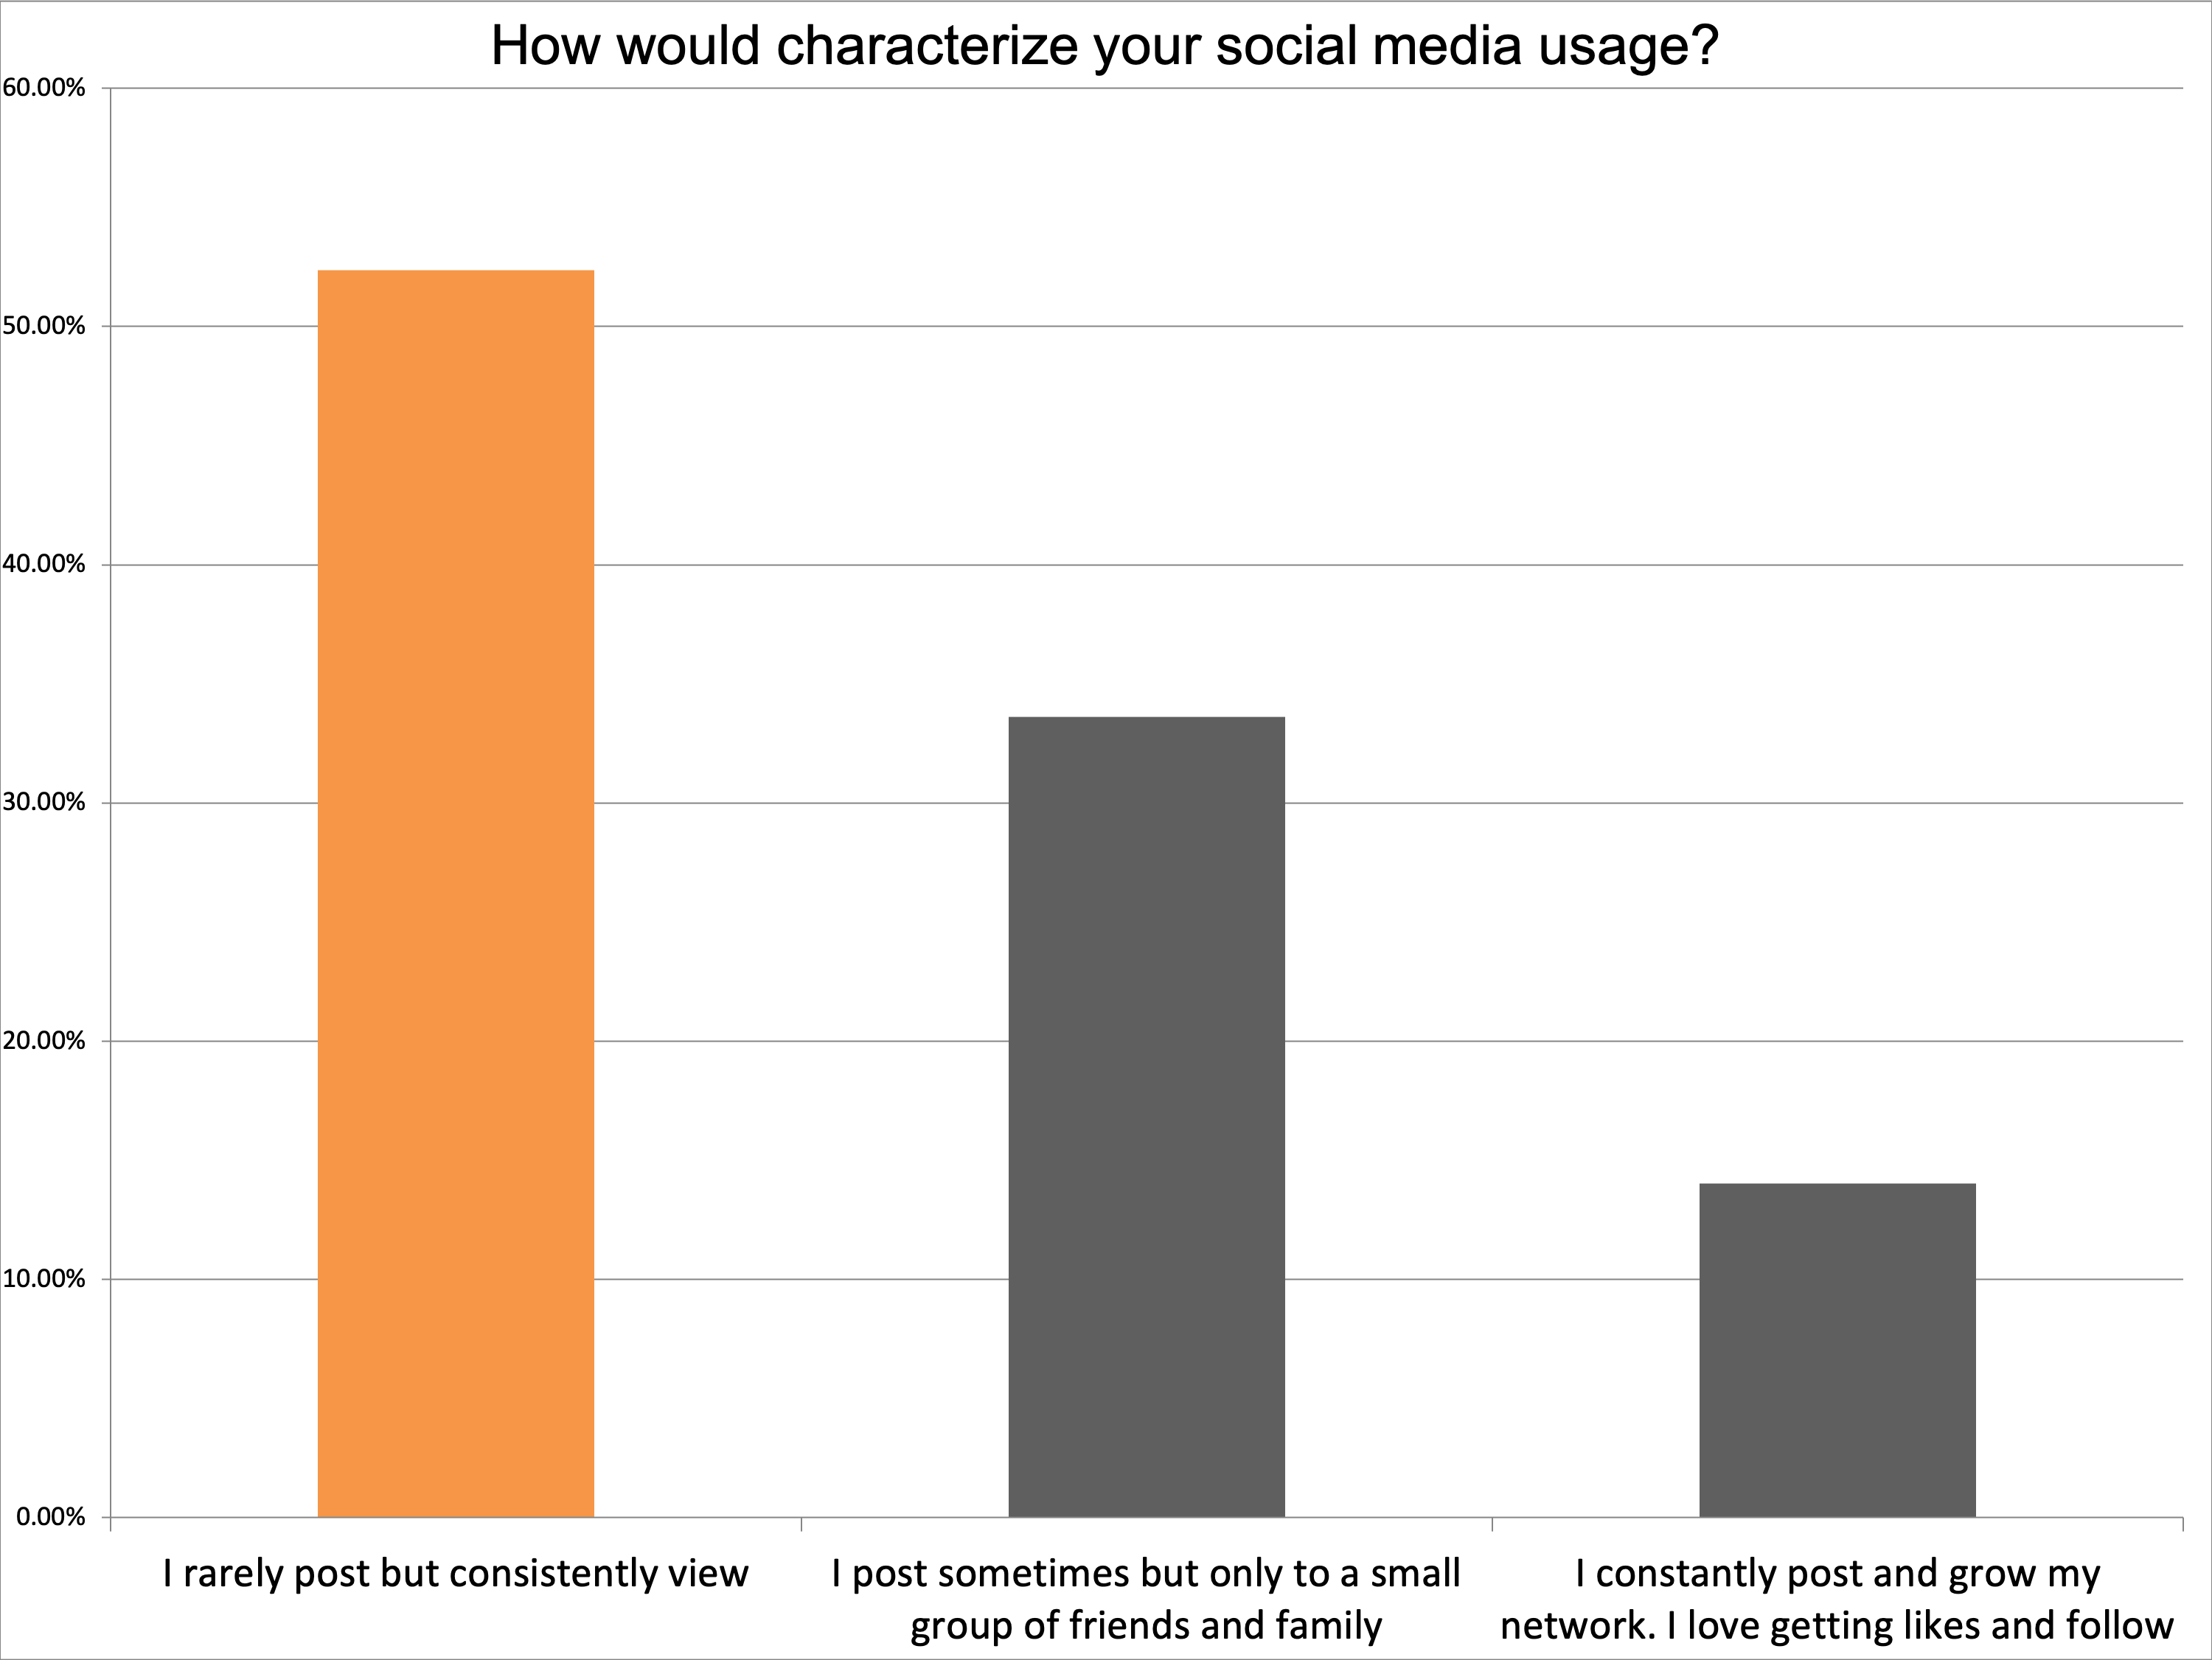
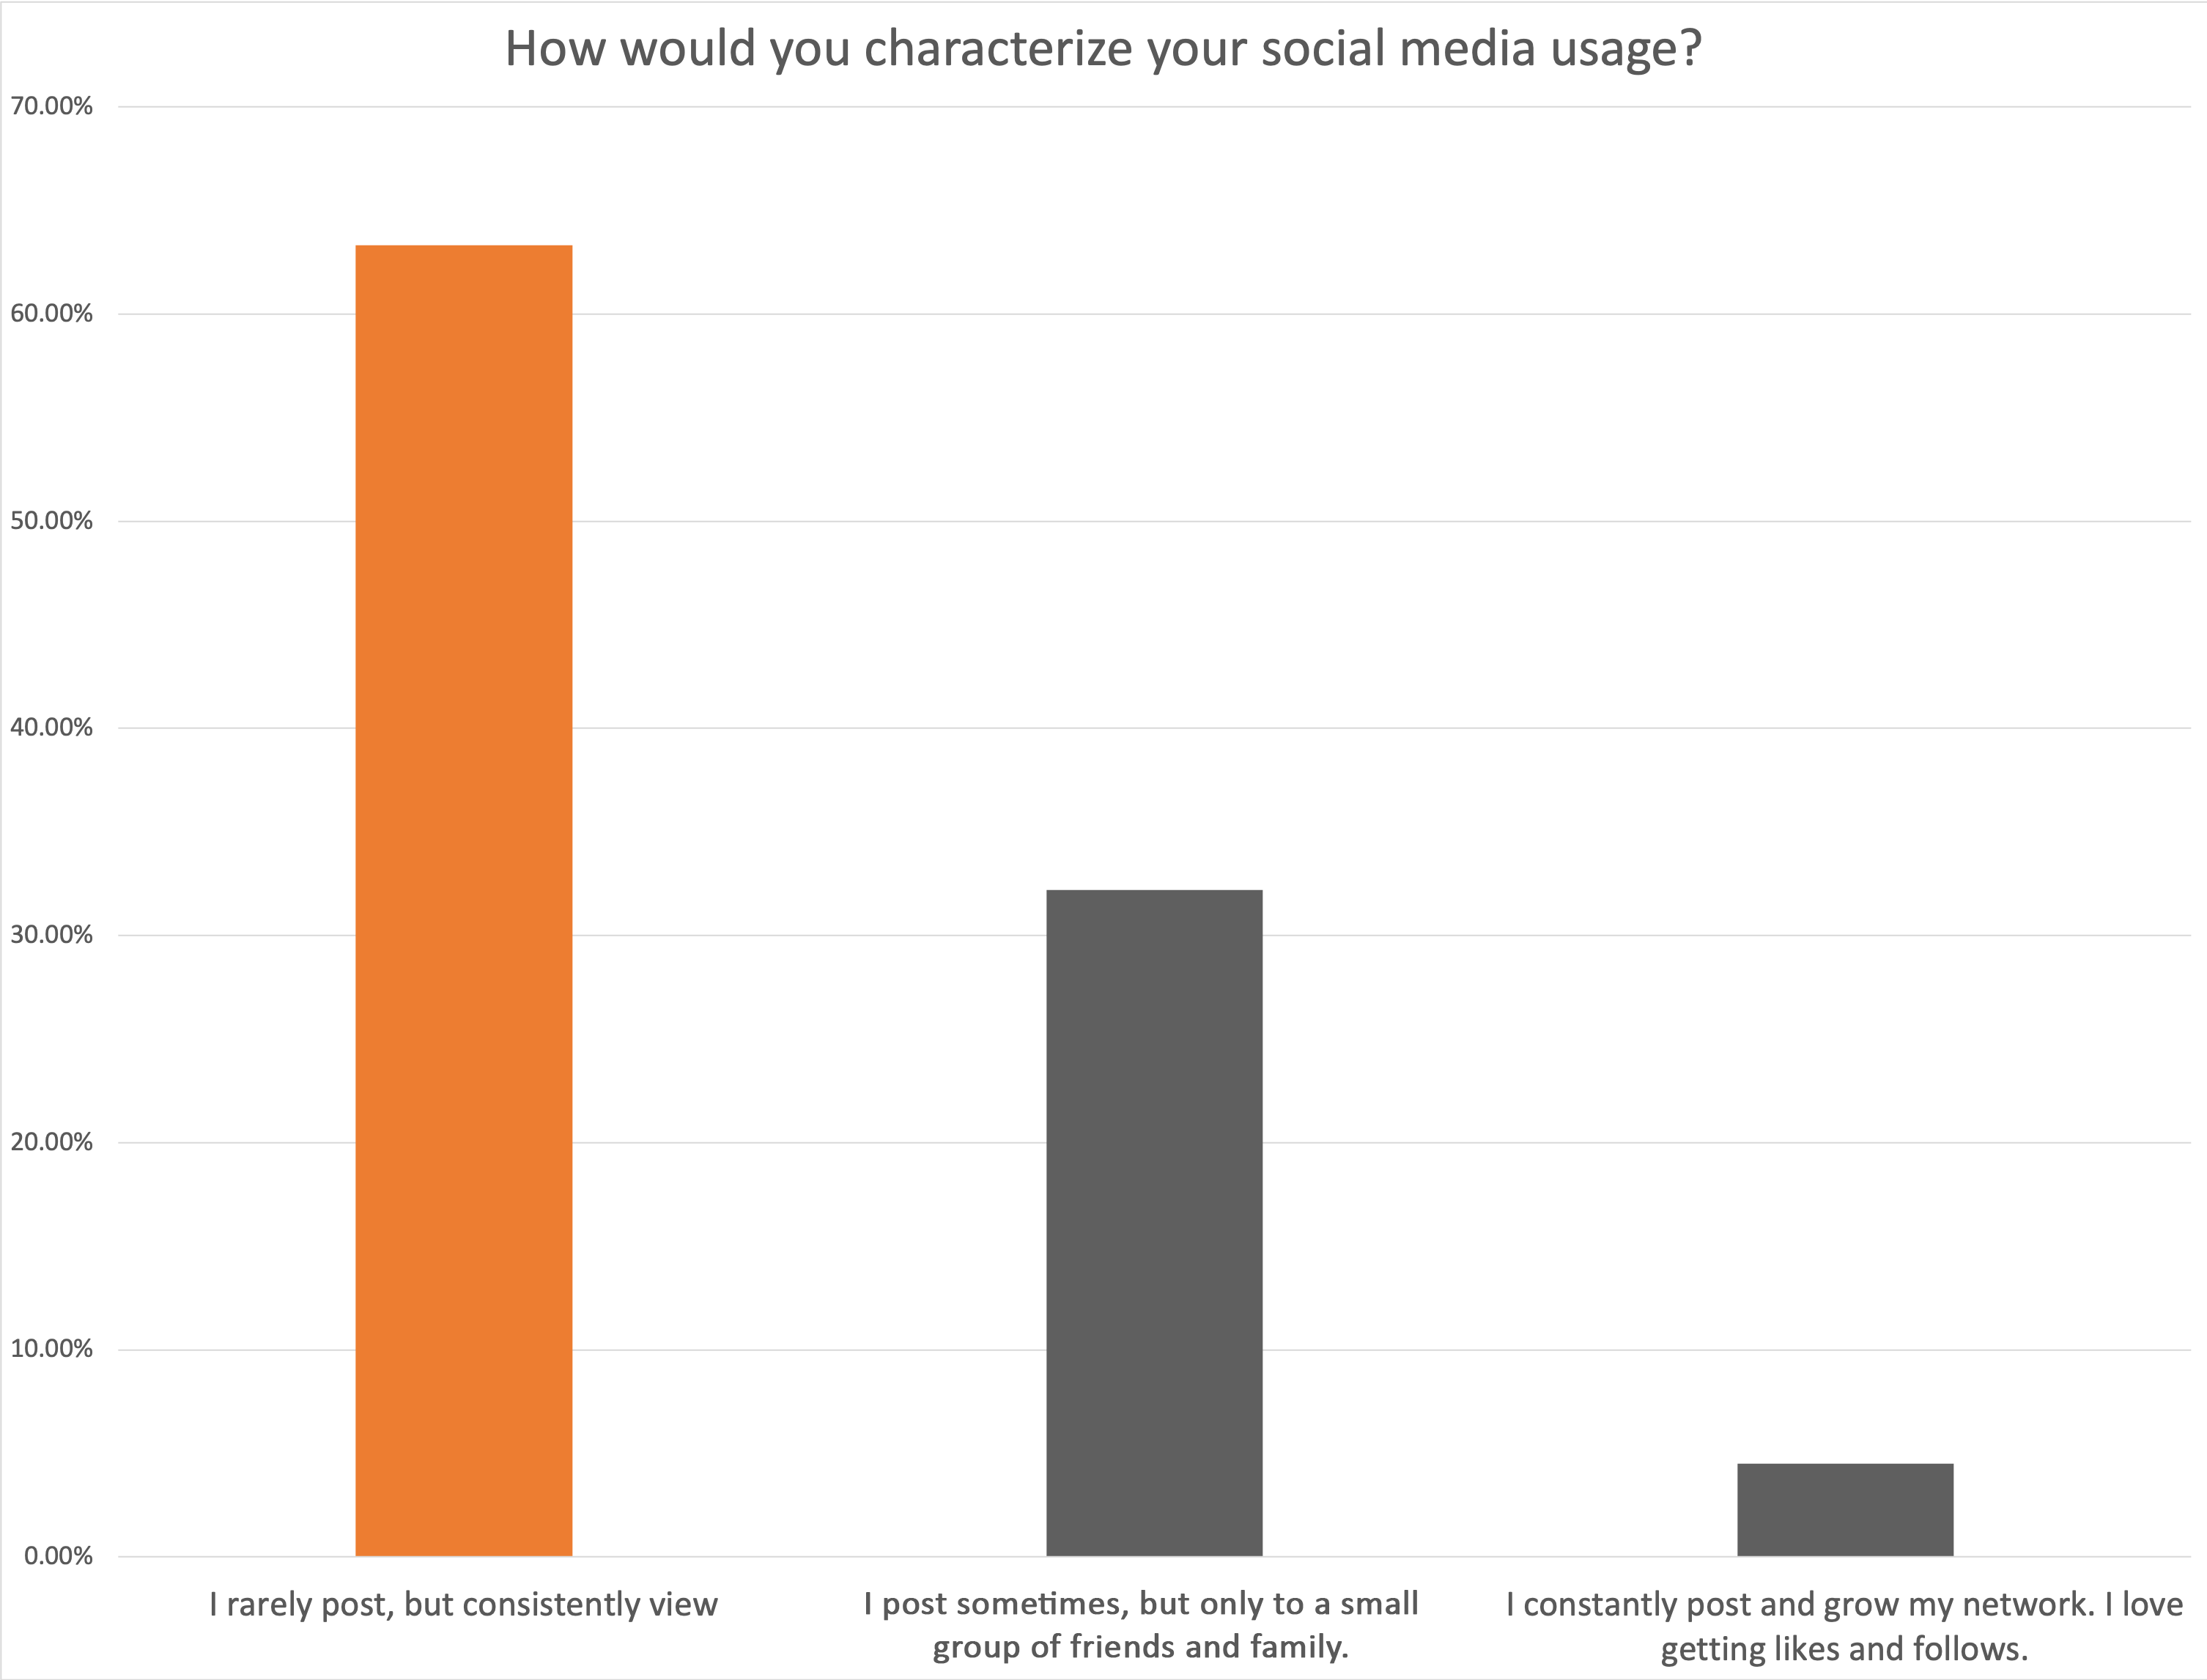
8. High School Students Remain Social Media Voyeurs
In 2018, we introduced the question, “How would you characterize your social media usage?” The past four years’ responses continue to demonstrate that most students regularly view social media, but don’t often post.
Click images to enlarge
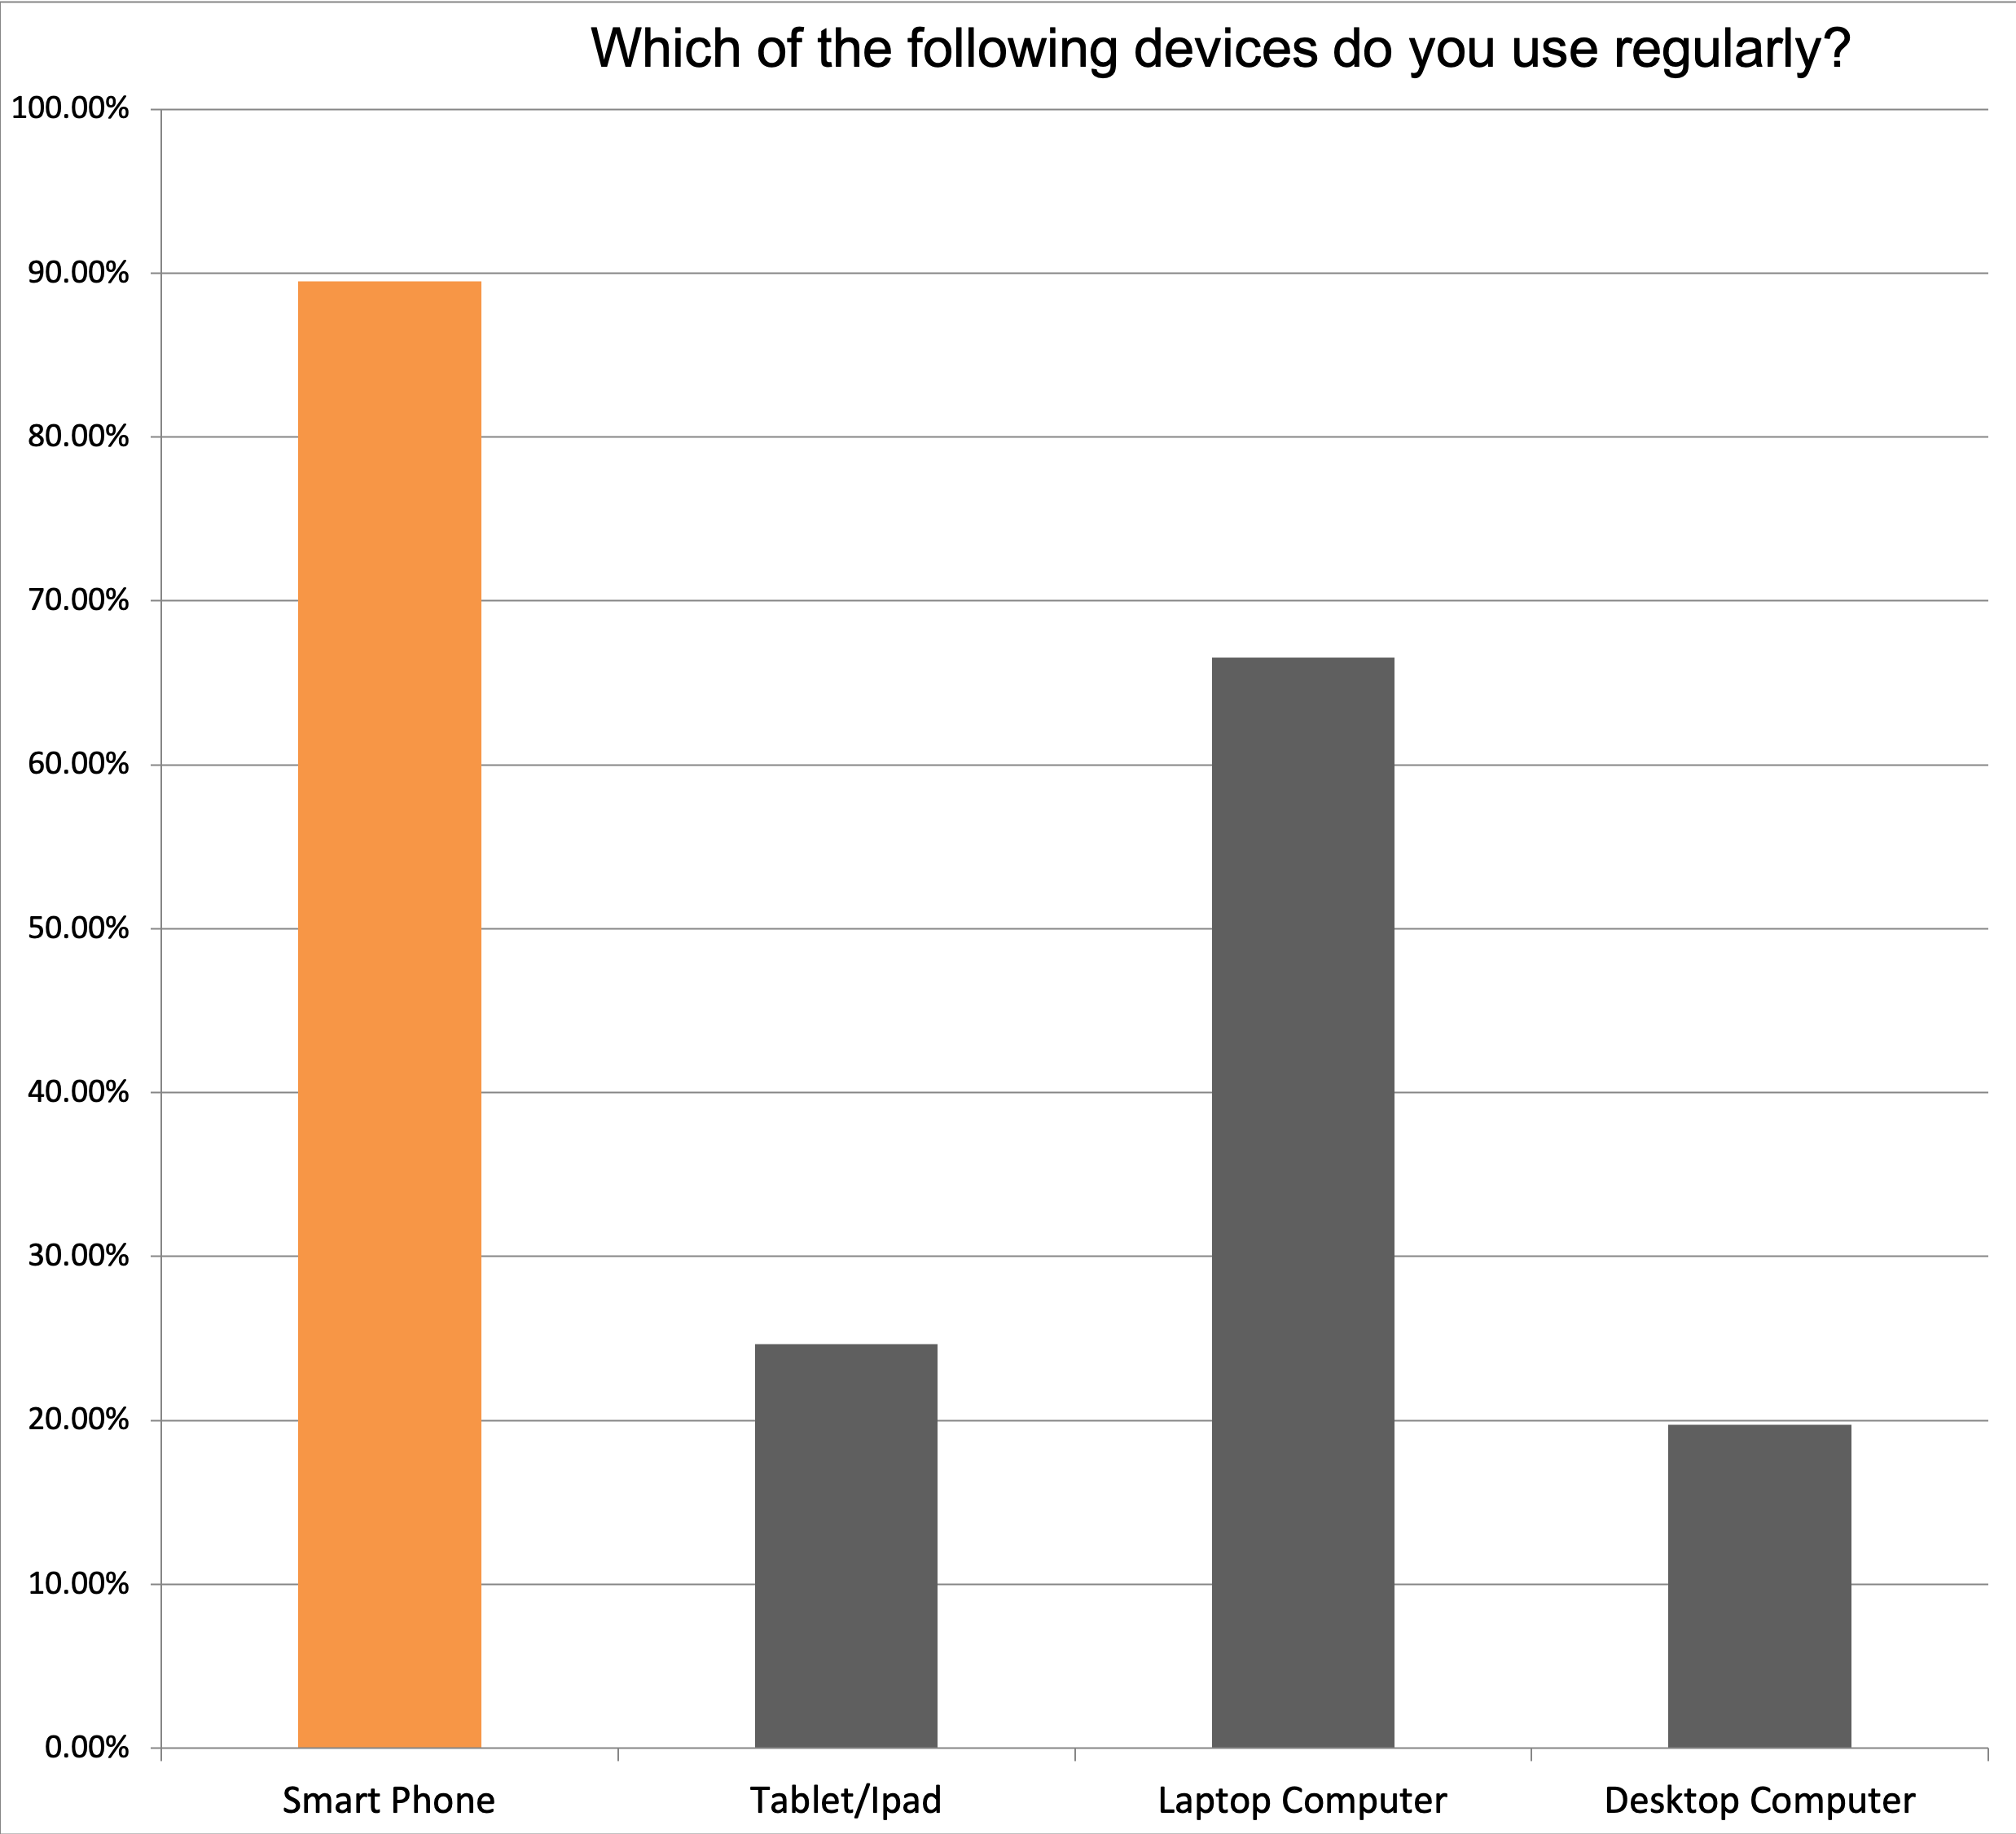
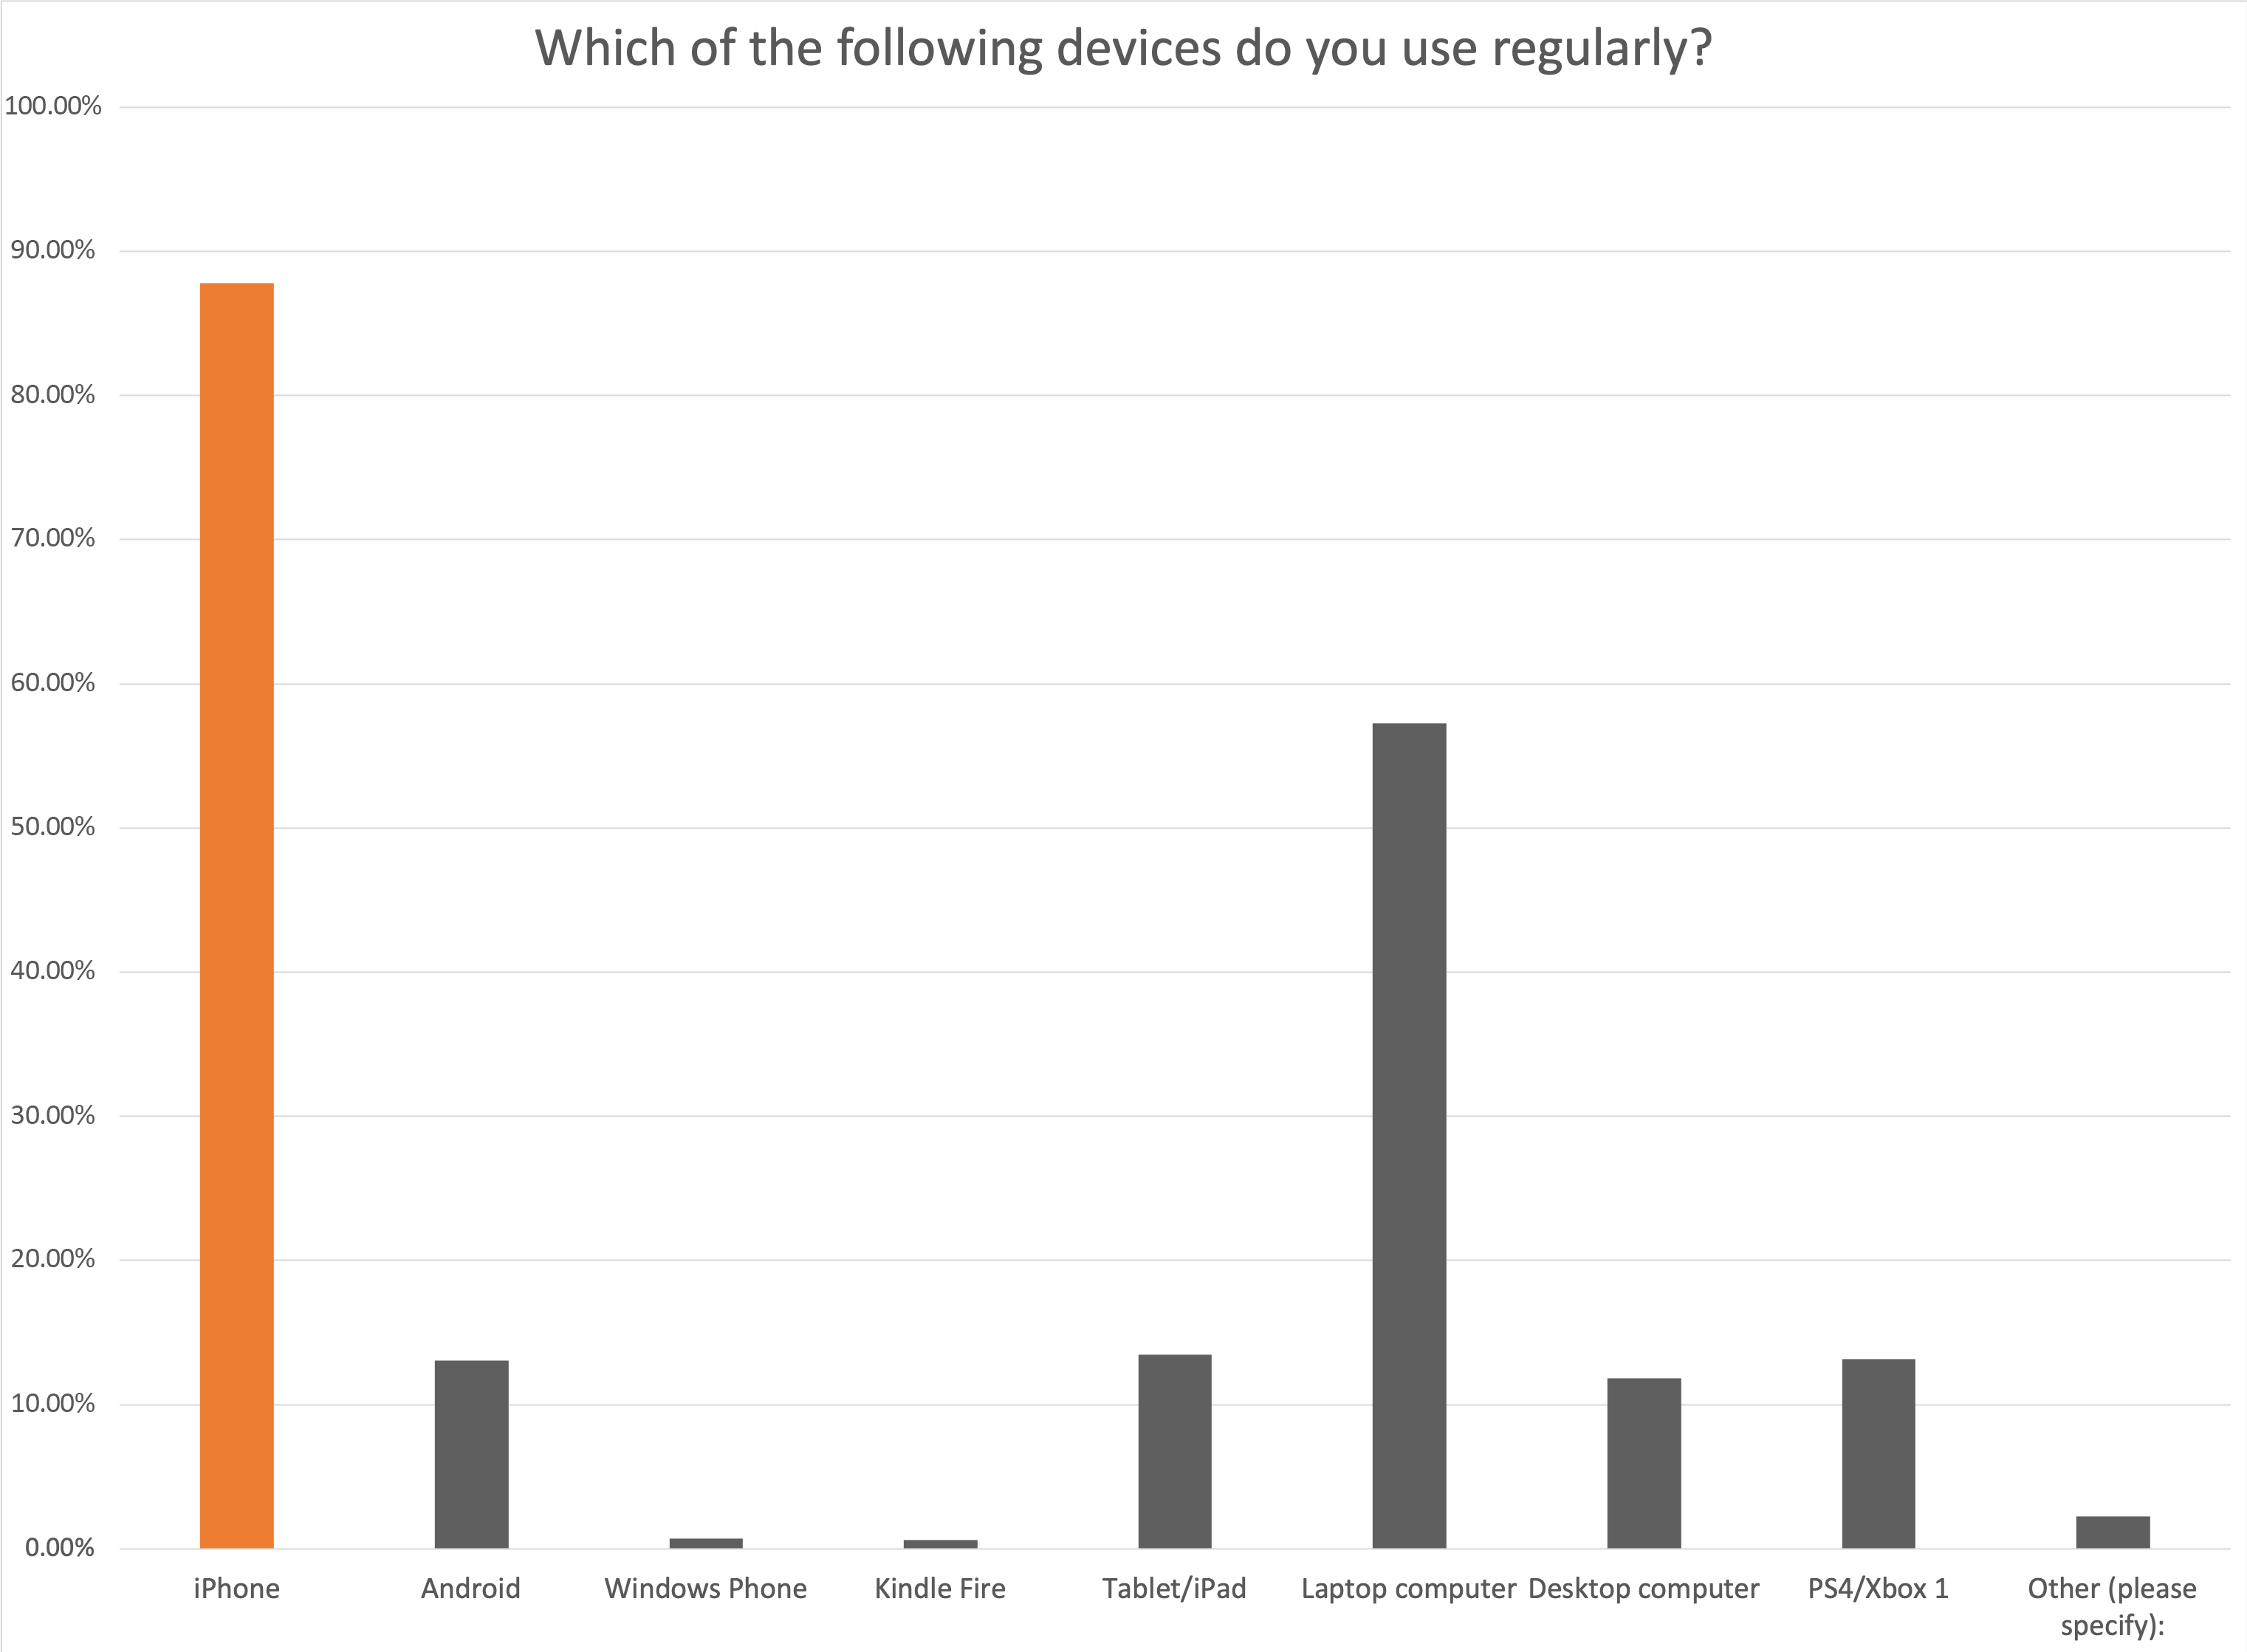
7. Device Usage
Over the last seven years, there have been incredible advancements in terms of market saturation and usage of technology devices—and we’ve had to evolve to keep up. As you’ll notice, in our more recent surveys, we’ve had to incorporate names of devices we never would have thought to ask about way back in 2014. While iPhones still rule the device world for high school students, the increasing availability and usage of other devices over the last several years is nothing short of amazing.
Click images to enlarge
6. Student Communication Preferences
Another question we introduced in 2013, and continue to seek feedback on today, relates to how students prefer potential colleges to communicate with them.
It may not surprise you to see that email continues to be the most preferred form of communication, but it’s certainly eye-opening to see how text messaging has slid into the number two slot from a minorly-ranked position.
Click images to enlarge
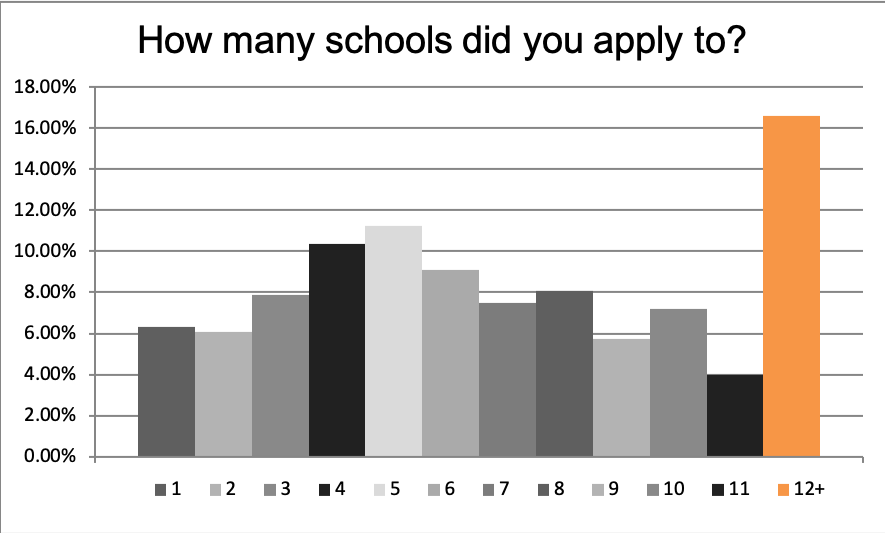
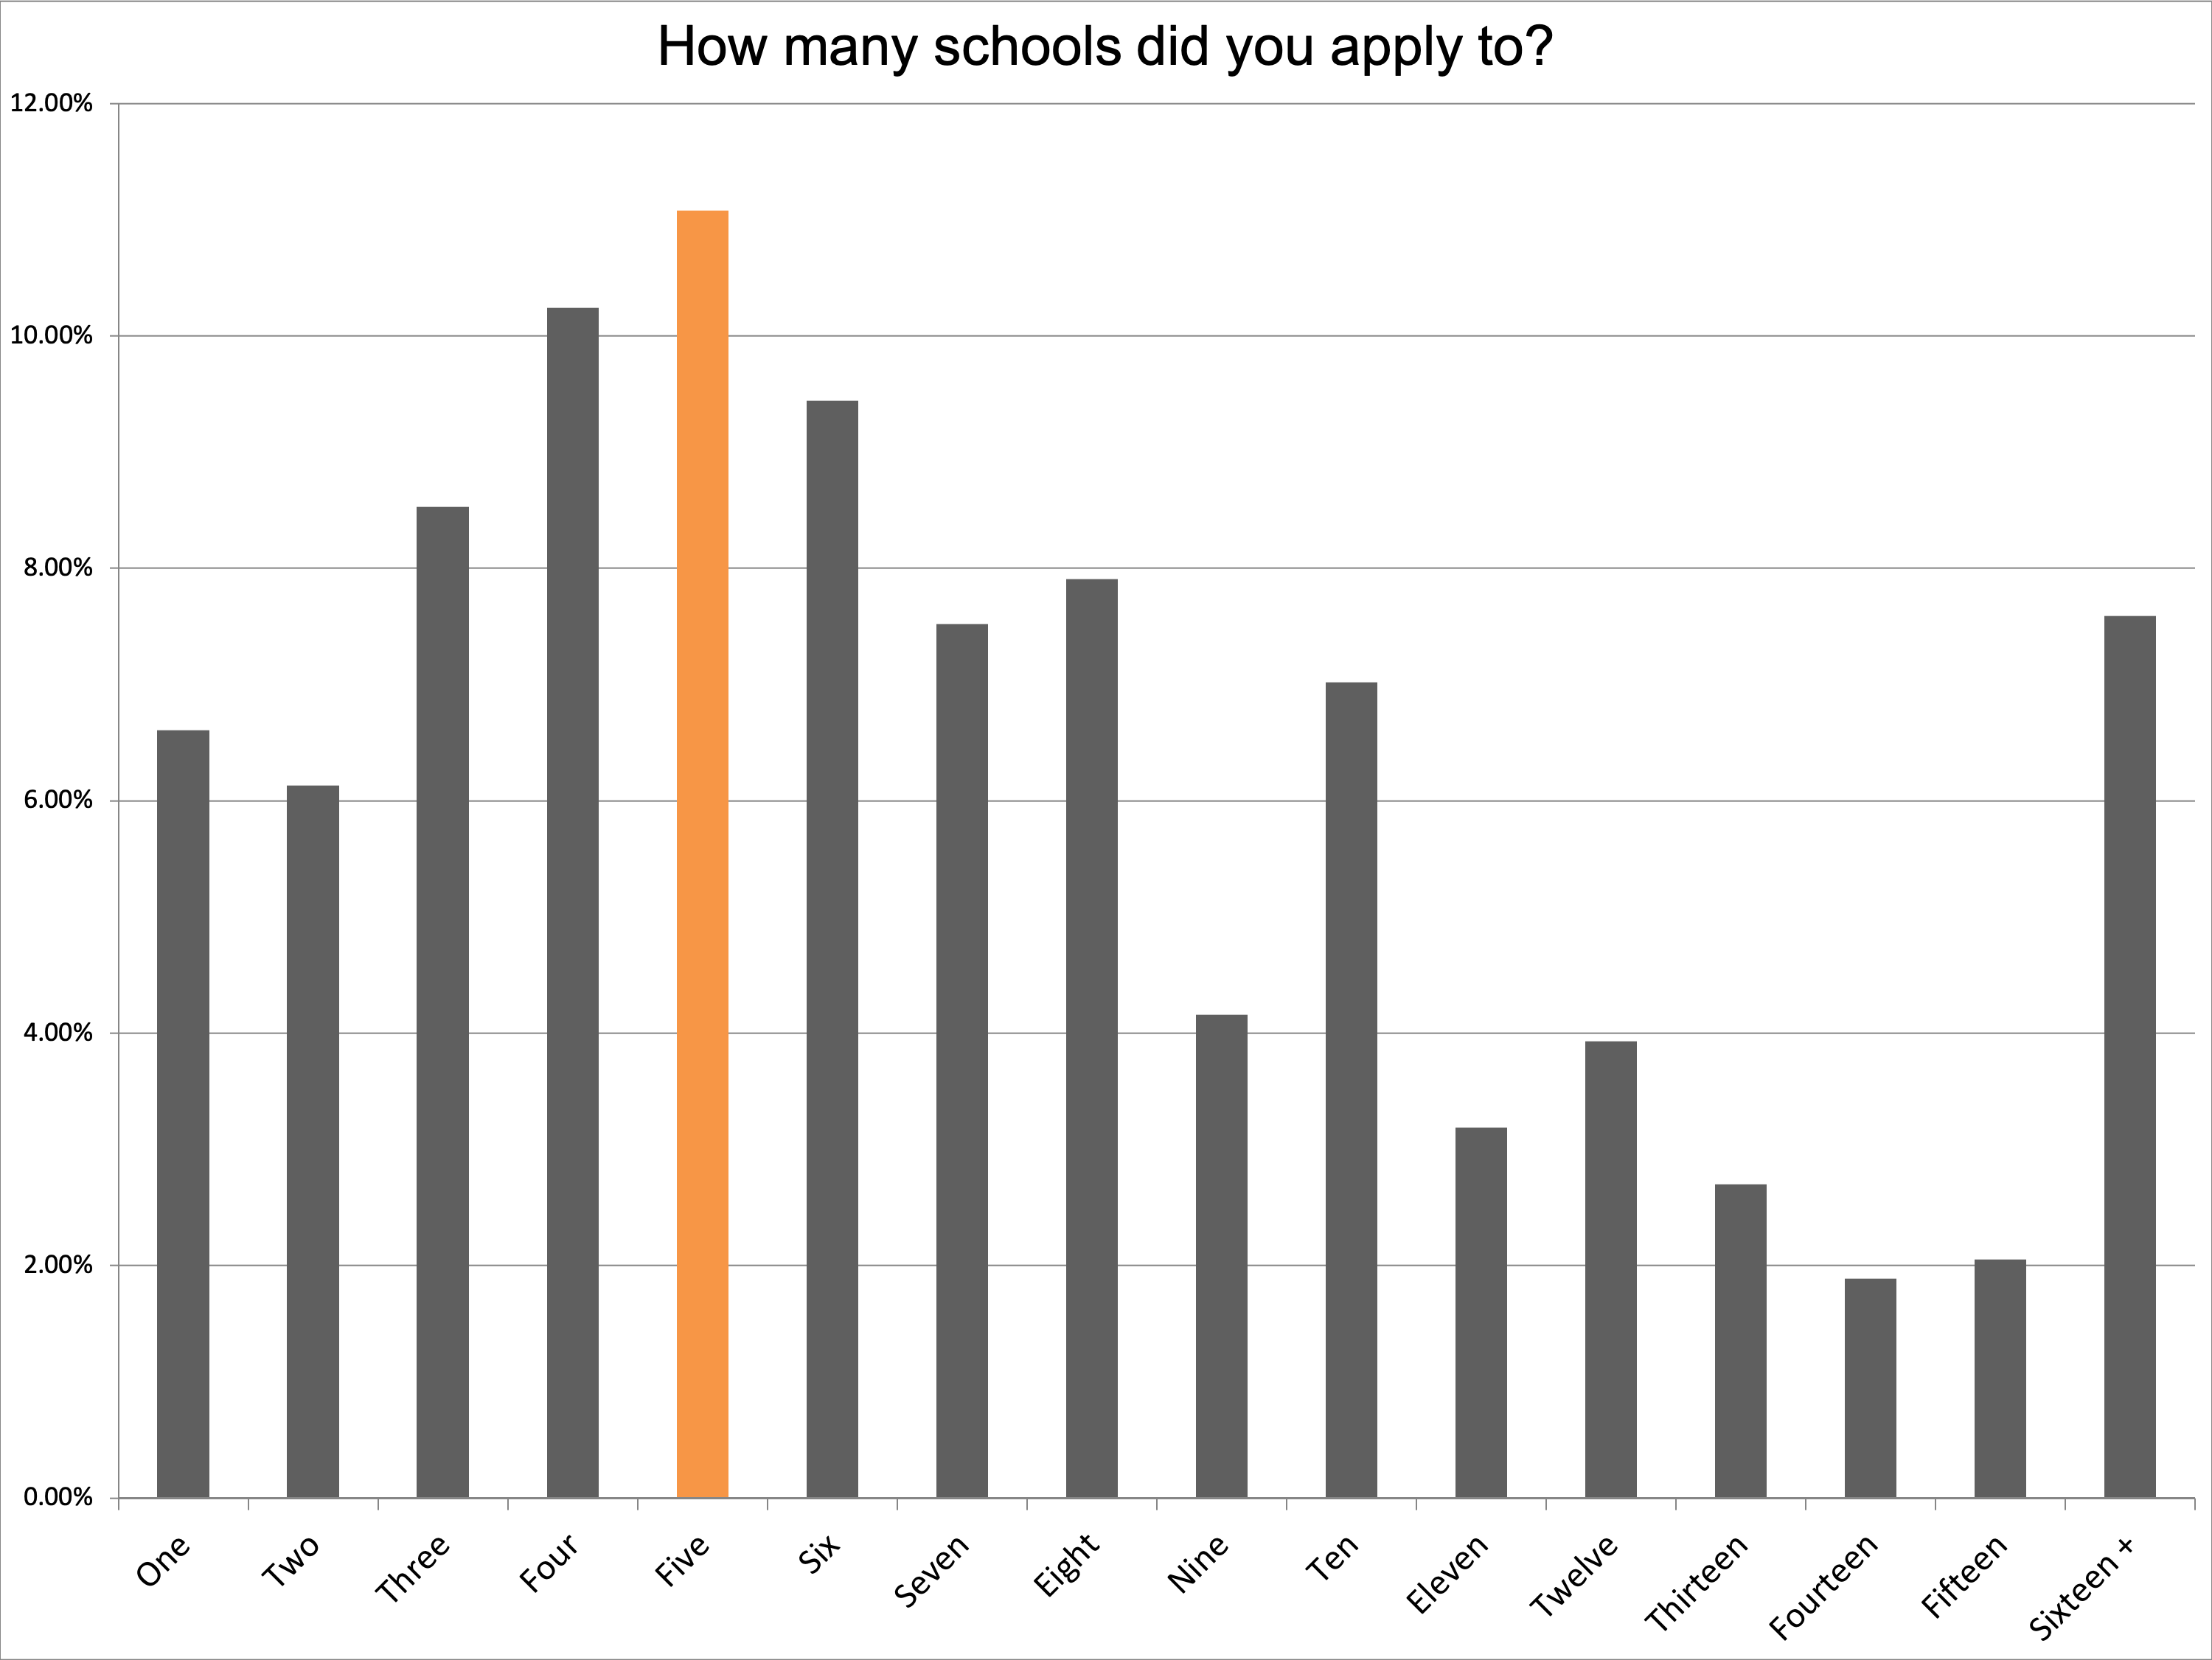
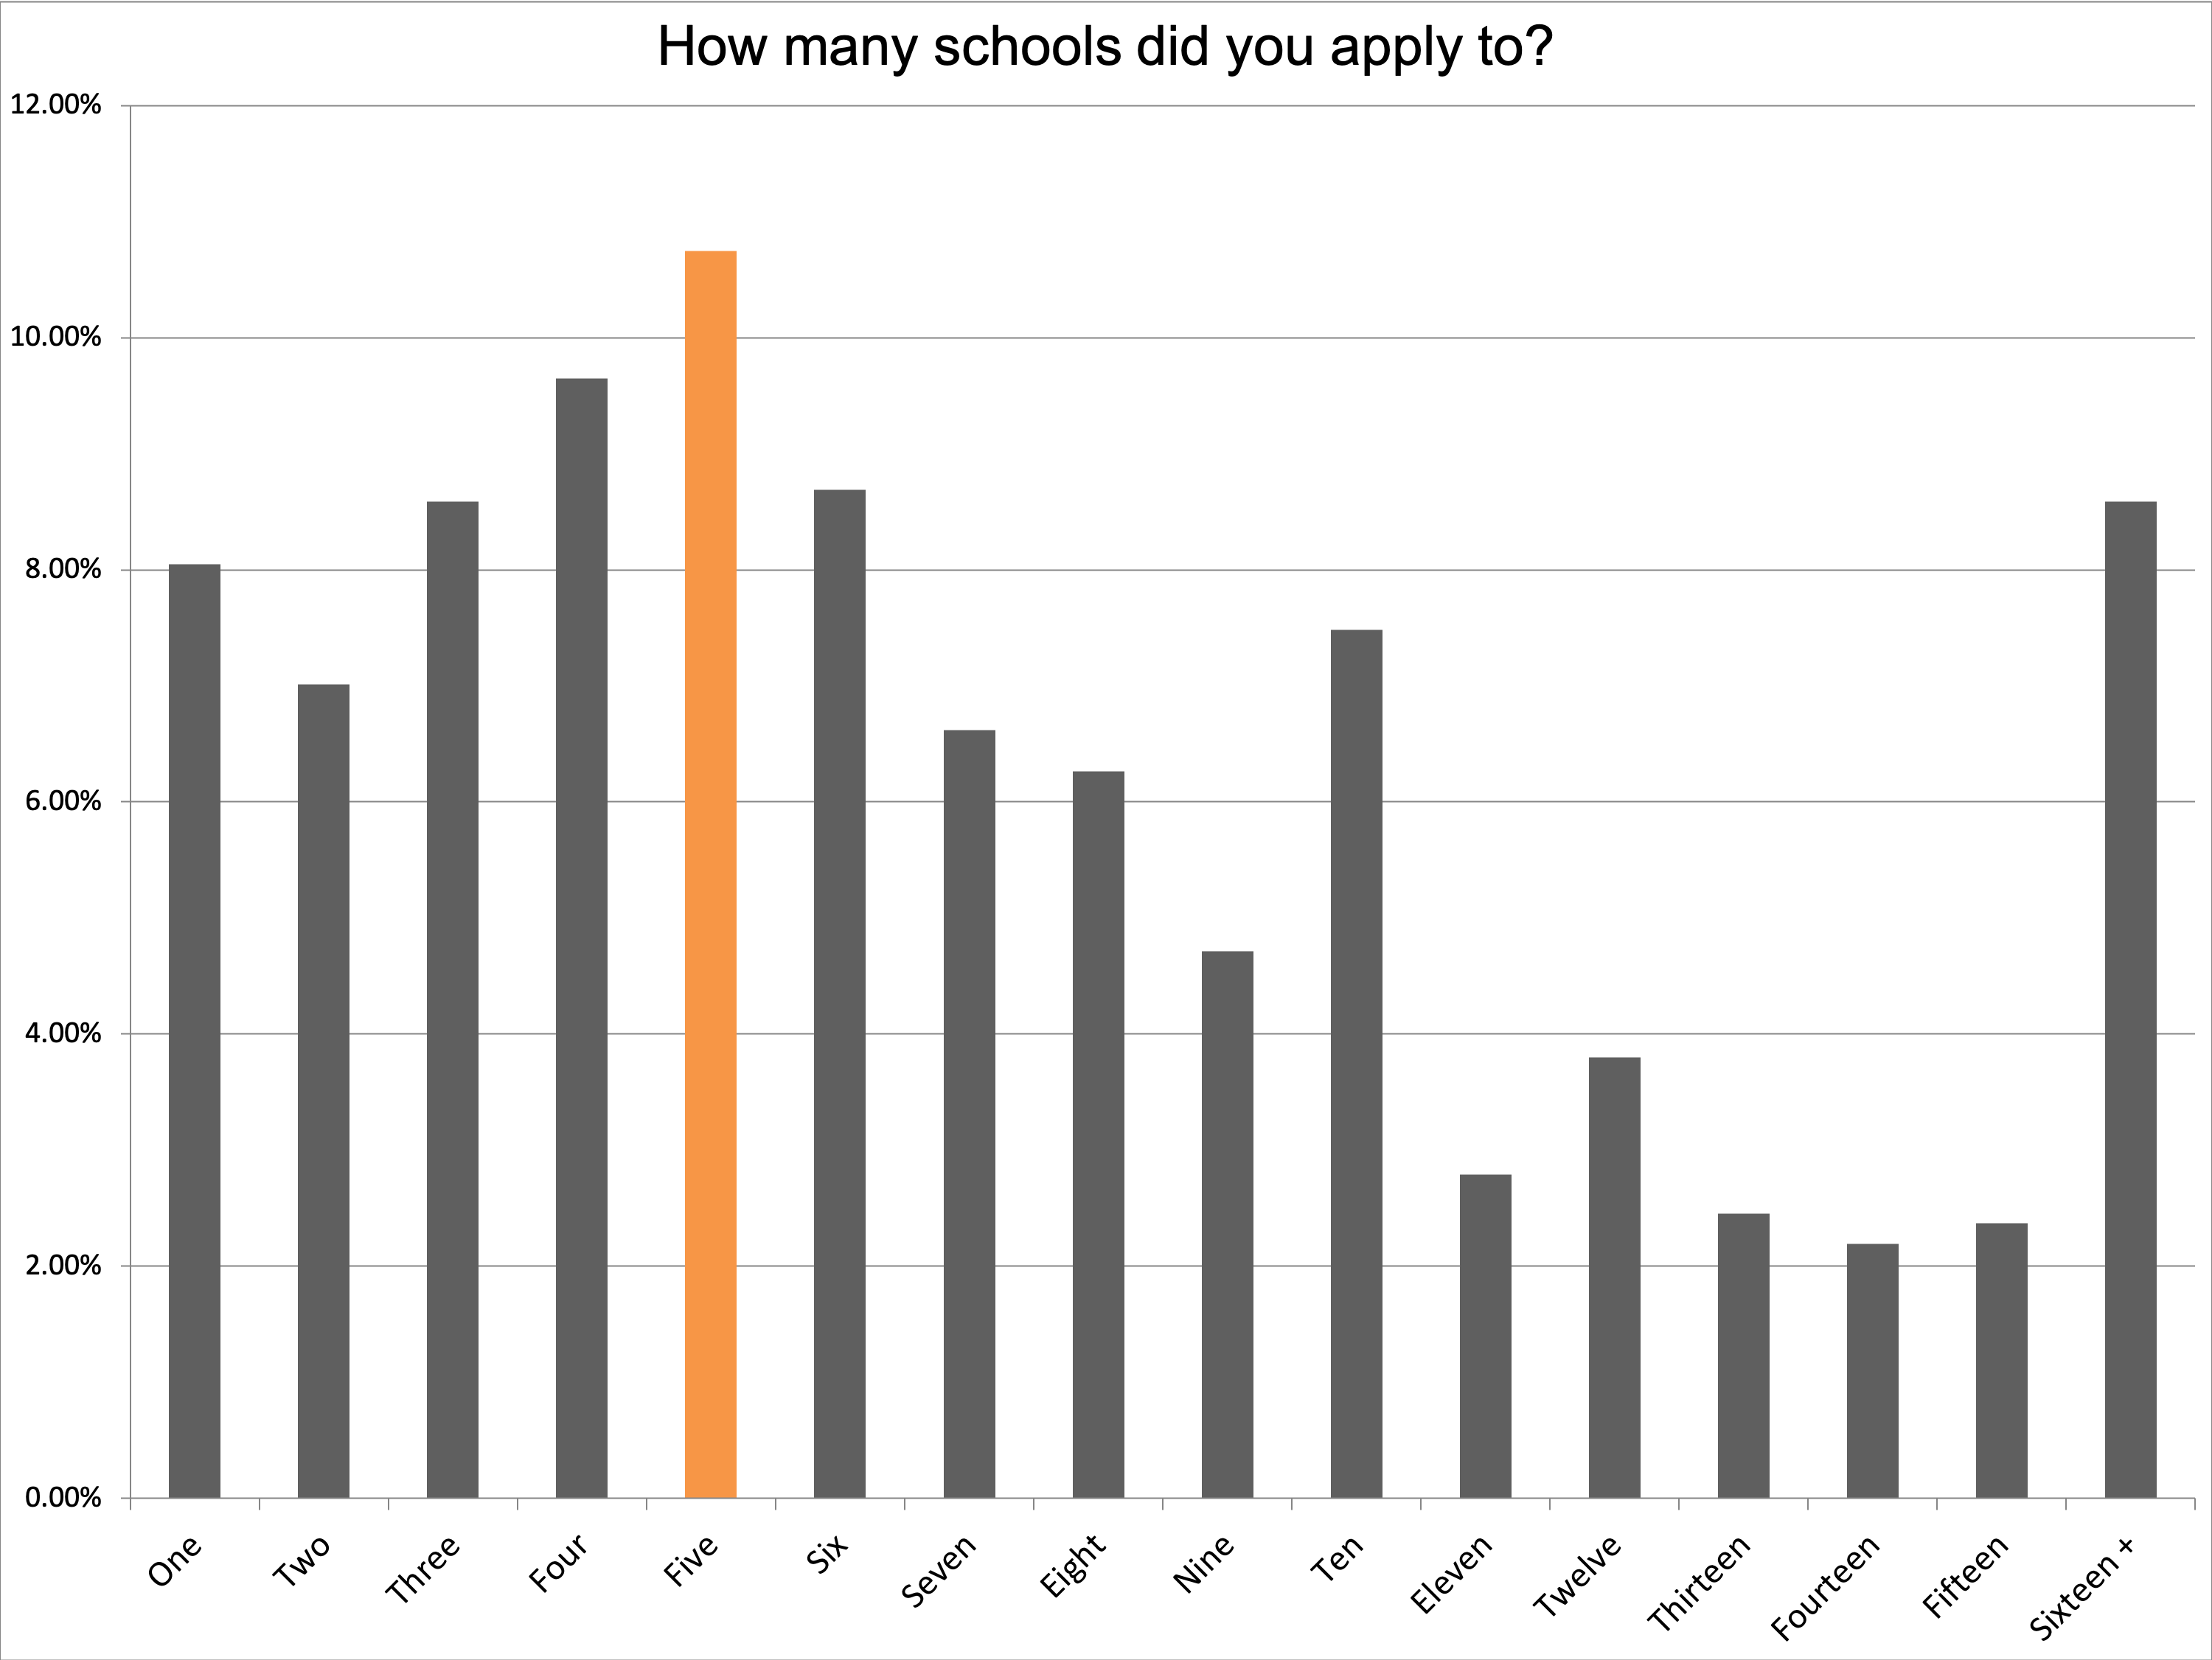
5. Applying to Colleges—Sheer Volume of Applications
Over the past decade, we have asked students to tell us the total number of schools to which they’ve applied. While we all have impressions of how this has shifted over the past 10 years, statistically, it has remained relatively flat. (Note: As you’ll notice, we expanded the number of options available over time in order to allow for a bit more specificity.)
Click images to enlarge
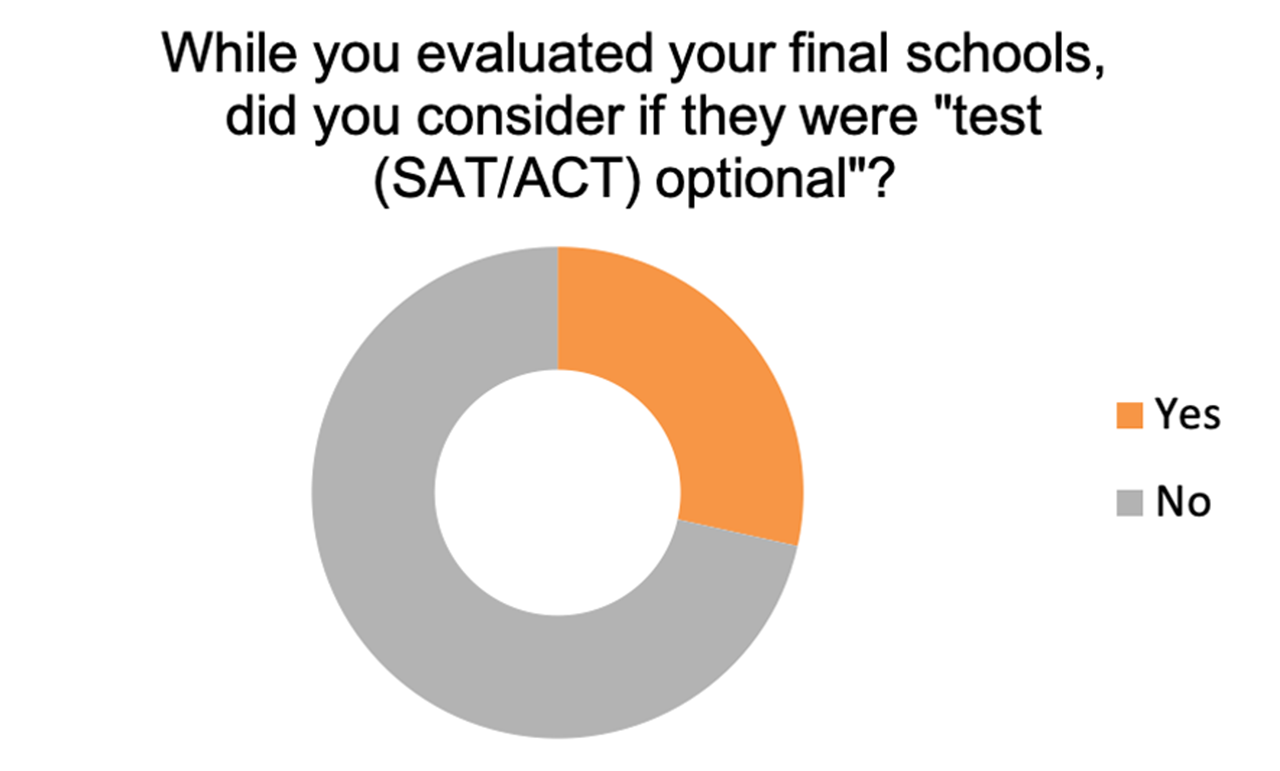
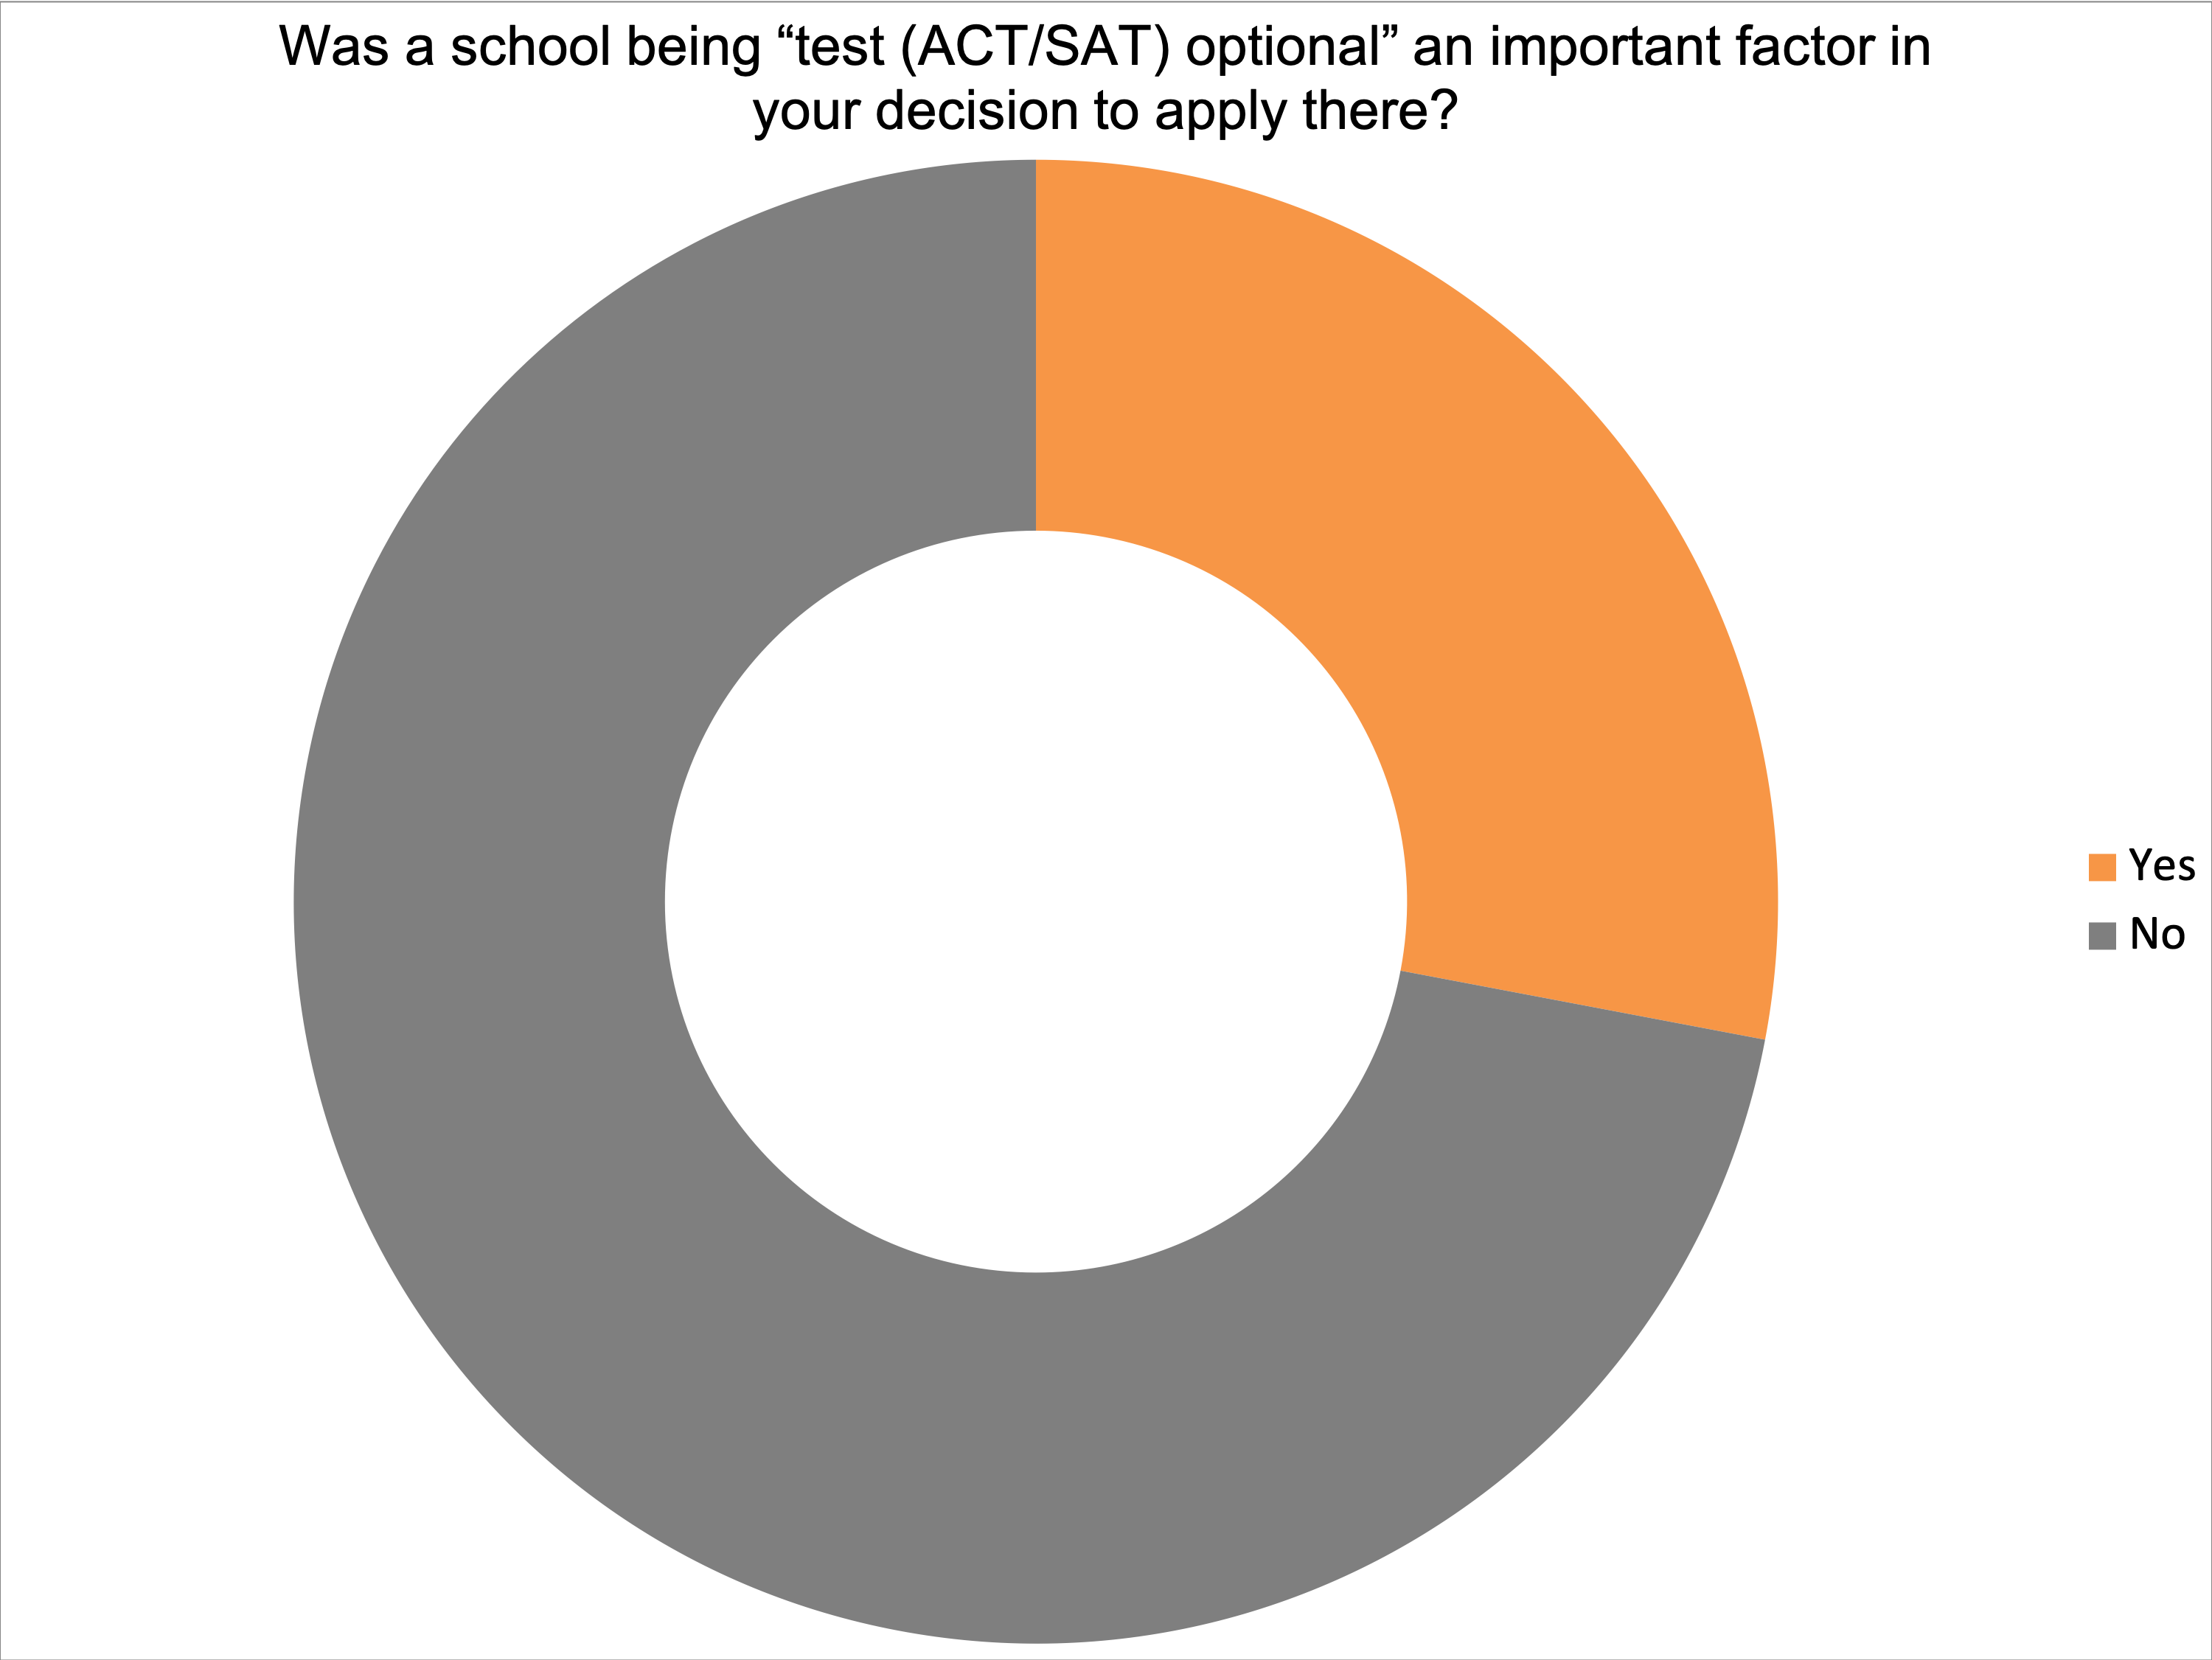
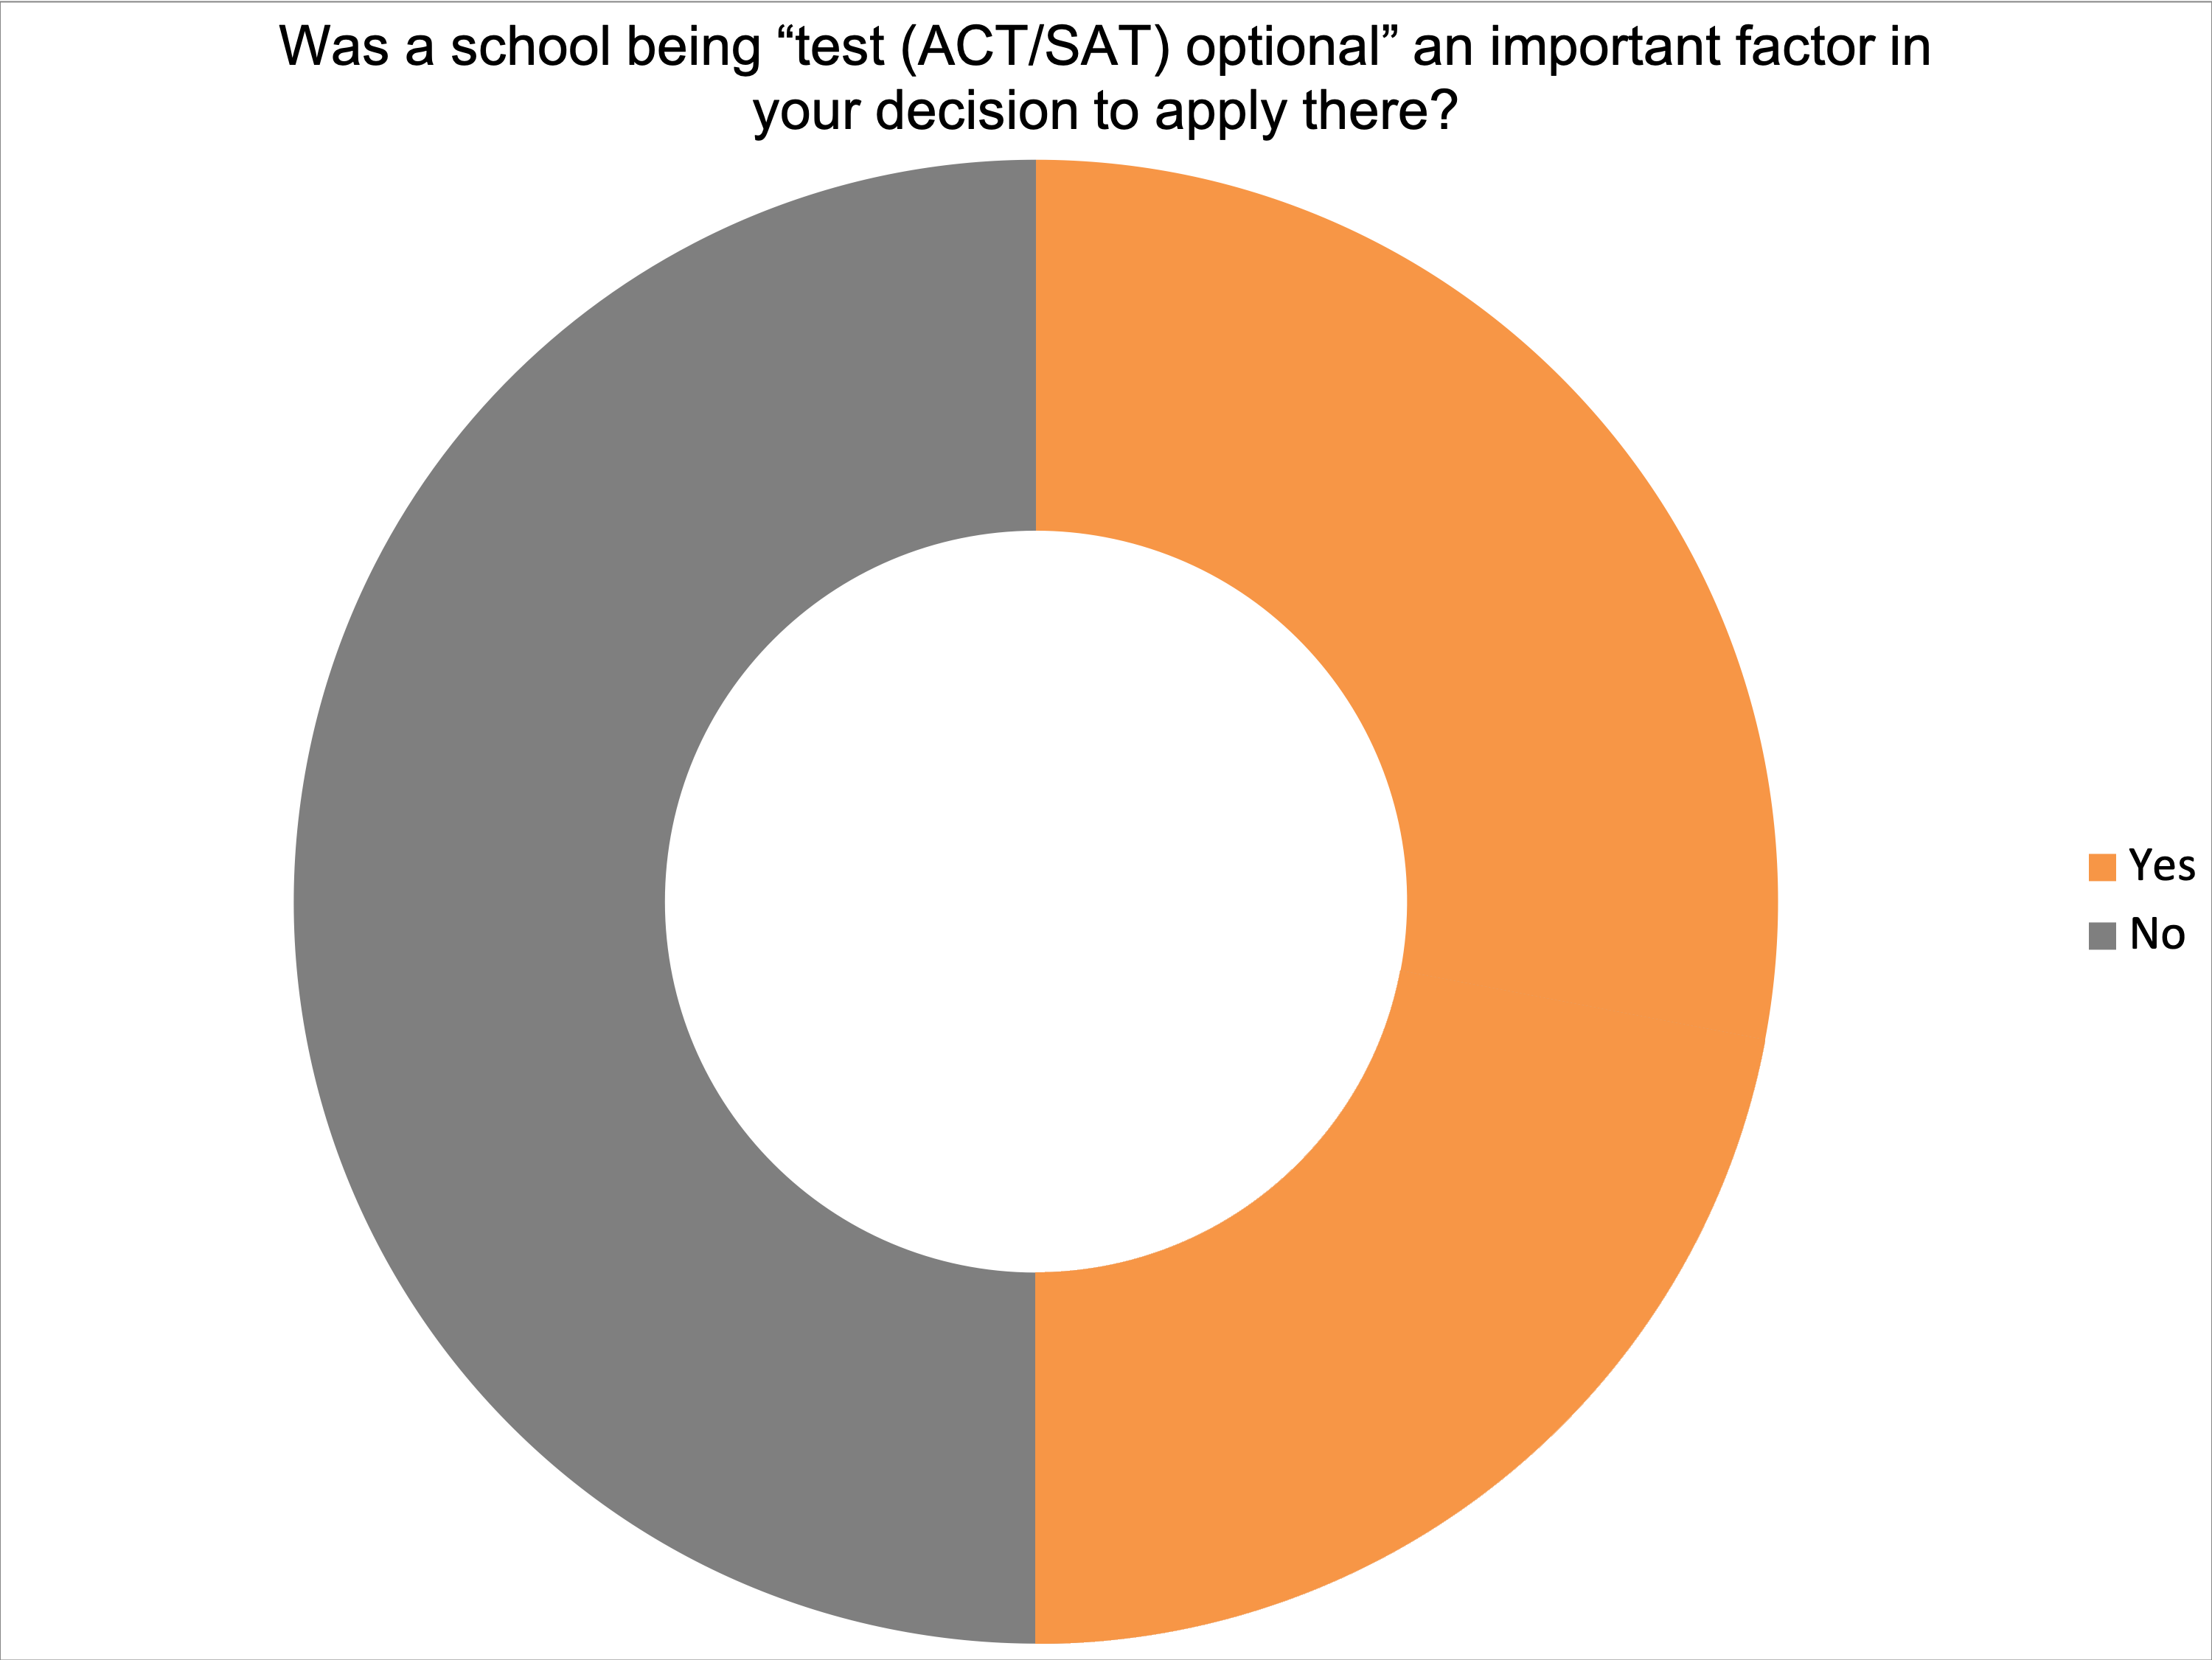
4. The Growth of Test-Optional Admissions
Understandably, COVID-19 accelerated the expansion of the test-optional environment; however, the number of students interested in considering a school because they were test optional almost doubled between 2013 and 2021.
COVID-19 was the primary factor driving an increase in students who wanted a test-optional admissions school. Between 2013 and 2019 (prior to COVID-19), the statistic remained quite flat.
Click images to enlarge
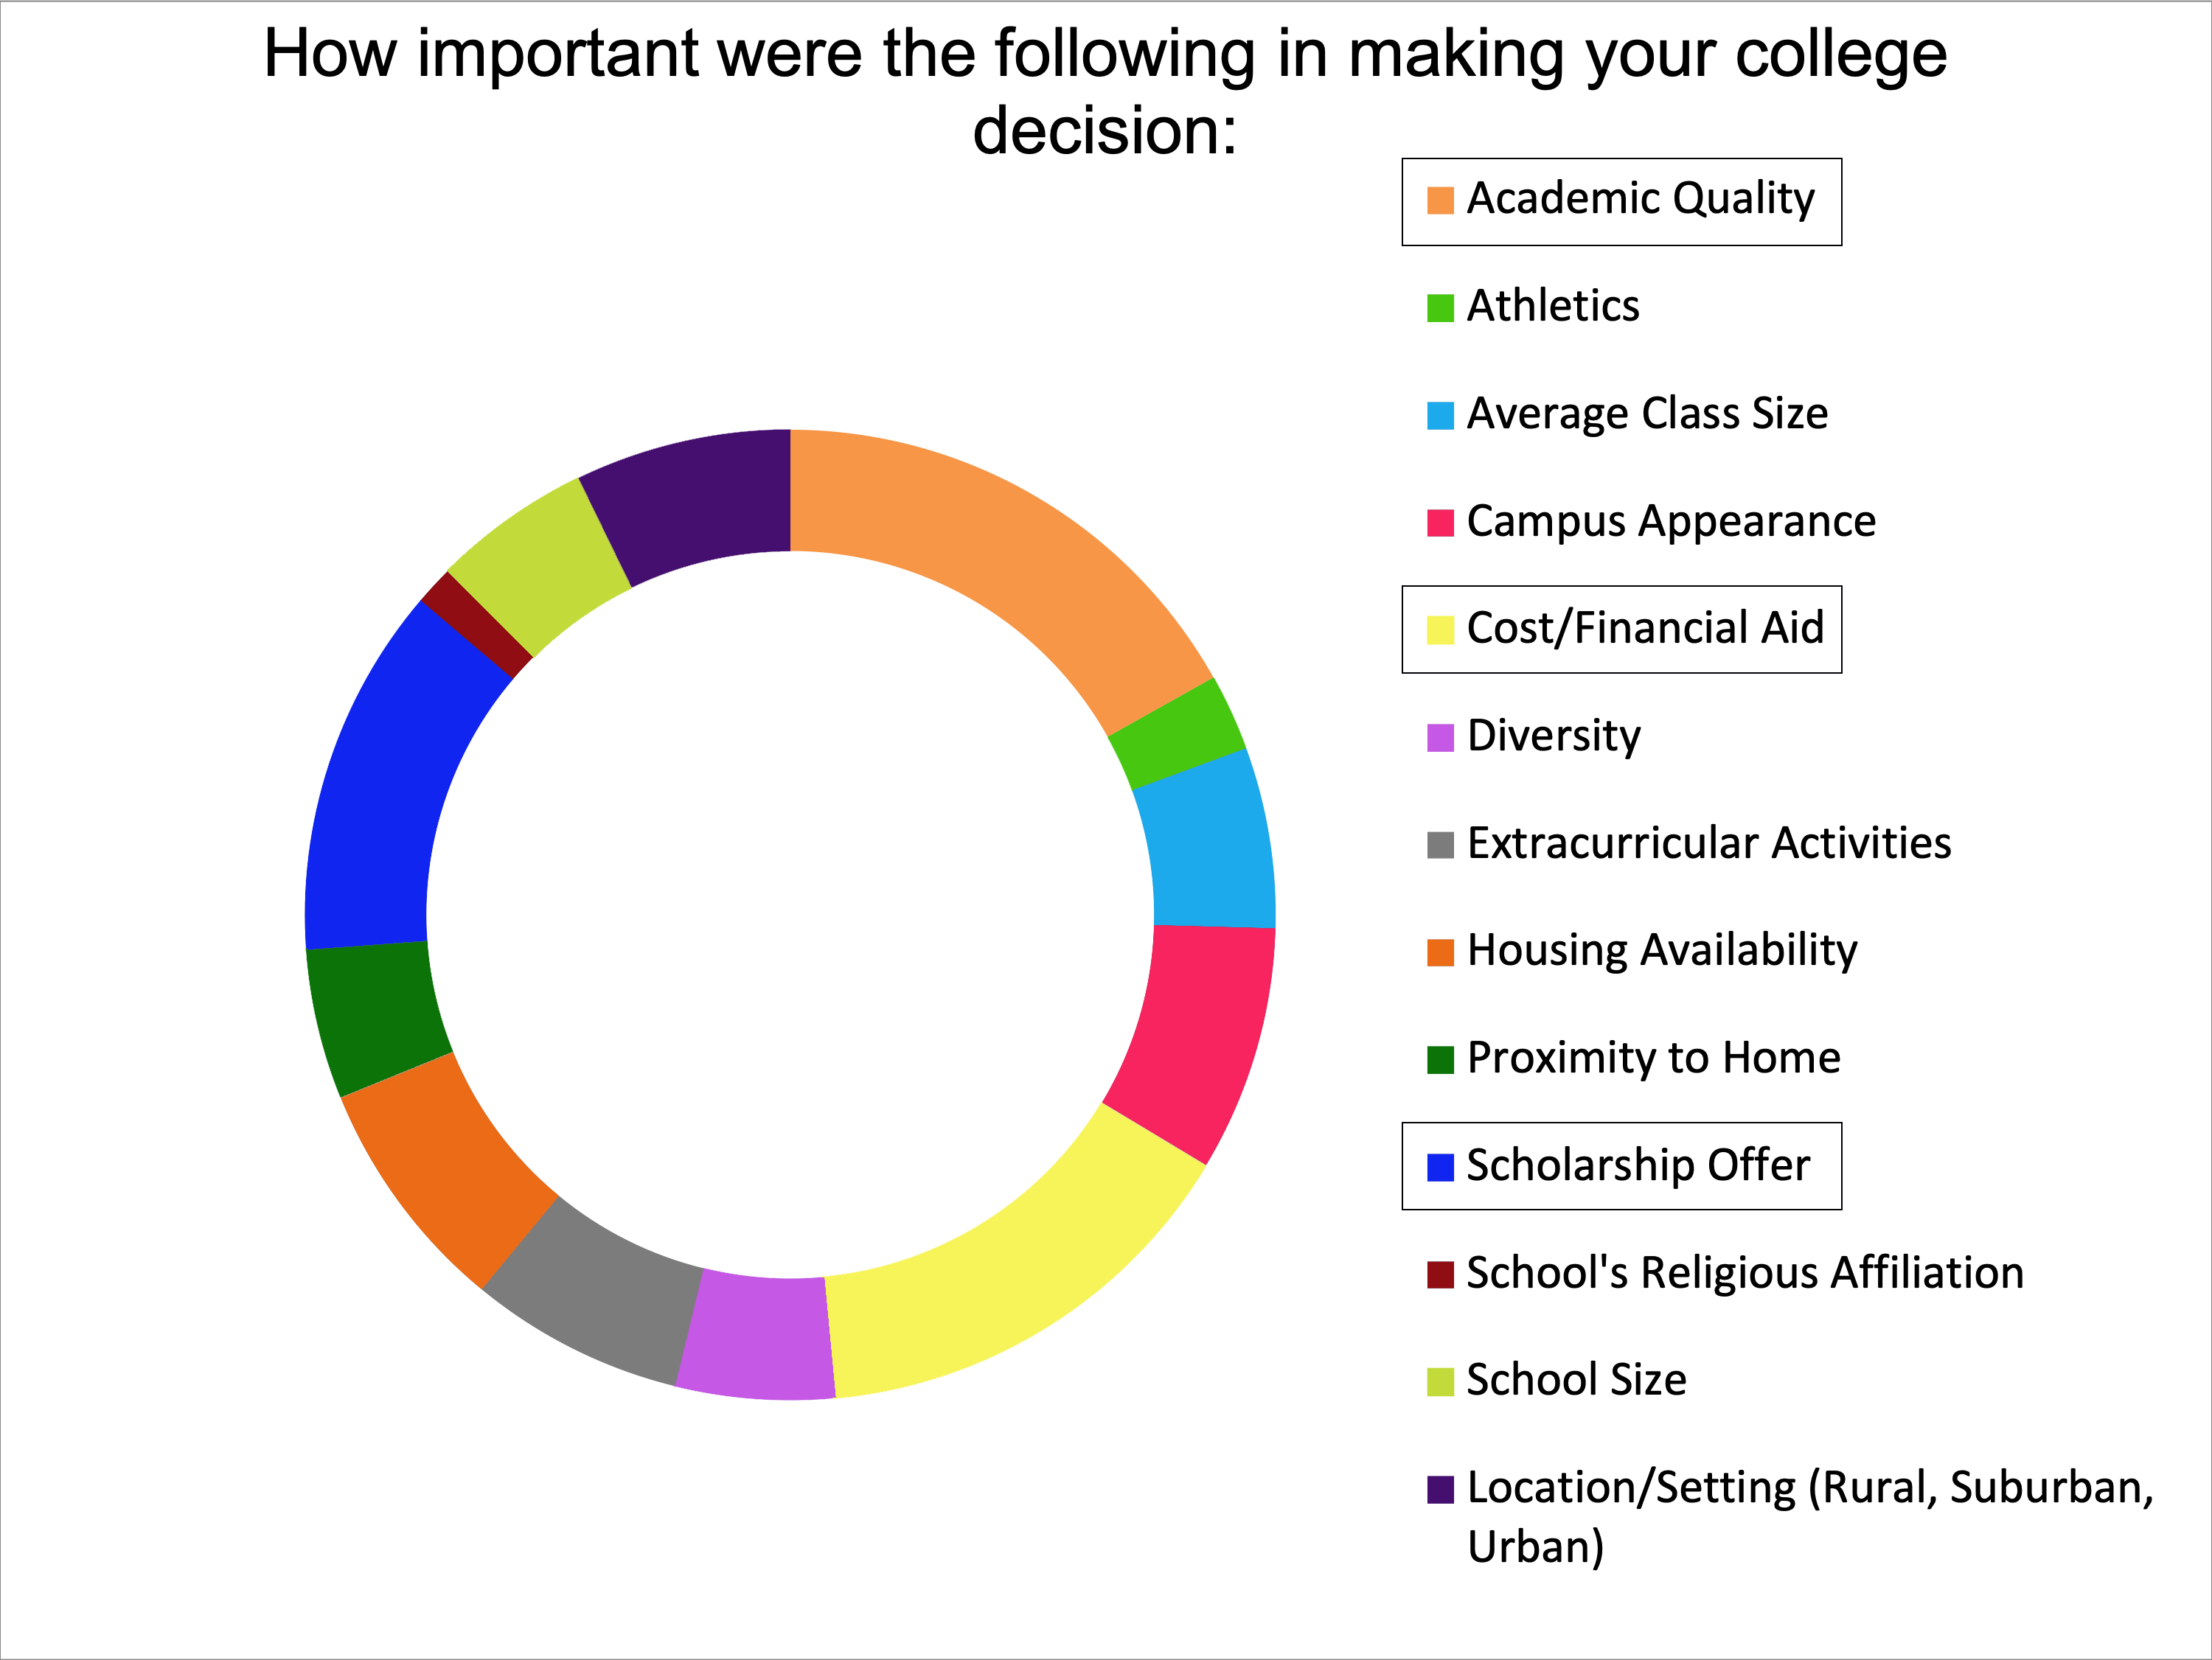
3. Decision-Making Factors
Over the last decade, we have collected data from tens of thousands of students on what is most important to them when it comes to deciding on the right school. While there are some shifts among secondary factors, the primary three reasons they give haven’t changed one bit: academic quality, cost/financial aid, and scholarship offers consistently move the needle.
Over the past decade, we have asked this same question to parents of college-bound students. The only difference we saw from the students’ data is a flip of the first and second answer, making cost/financial aid the number one motivating factor for parents.
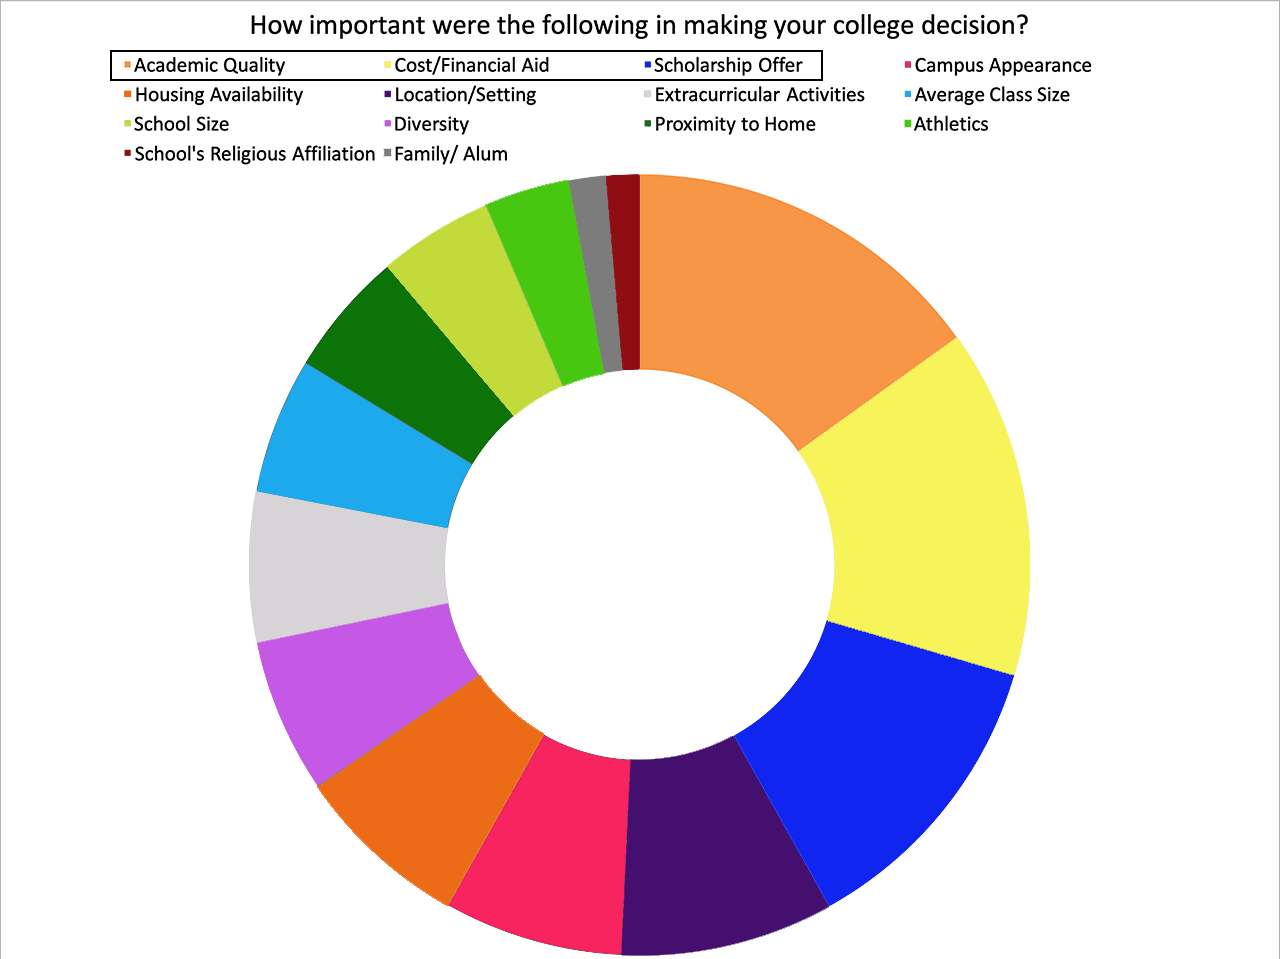
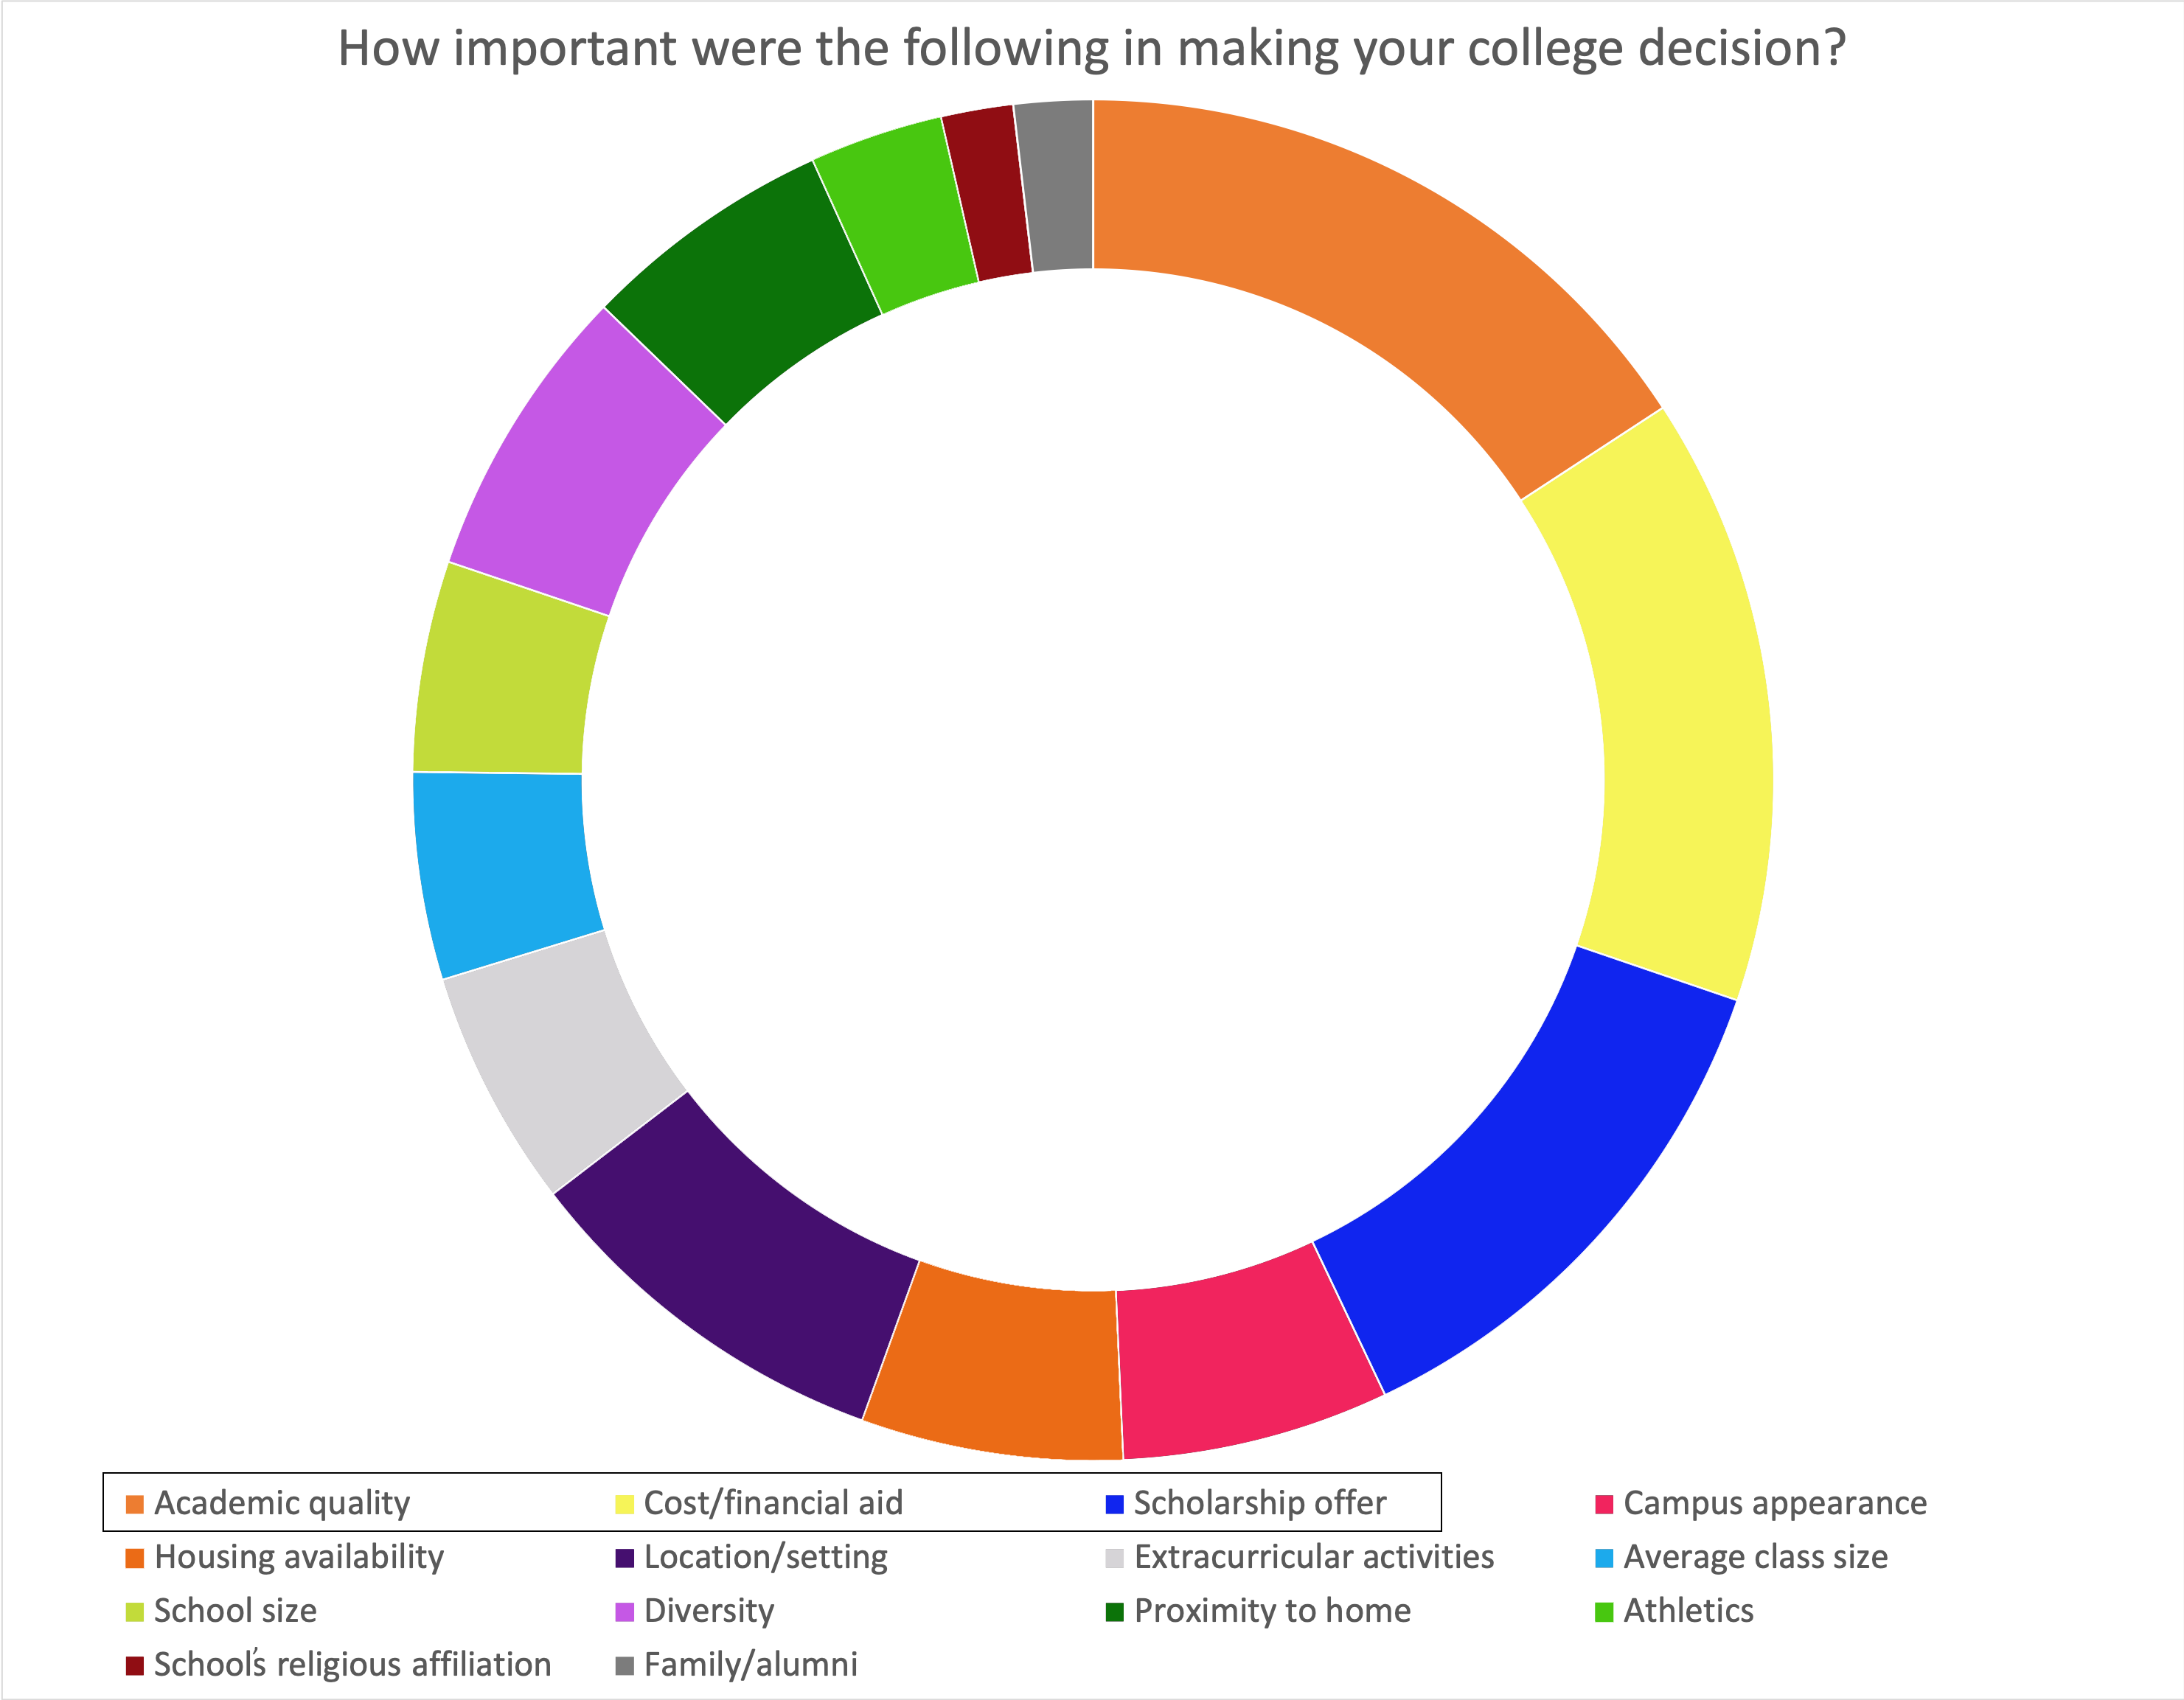
Click images to enlarge
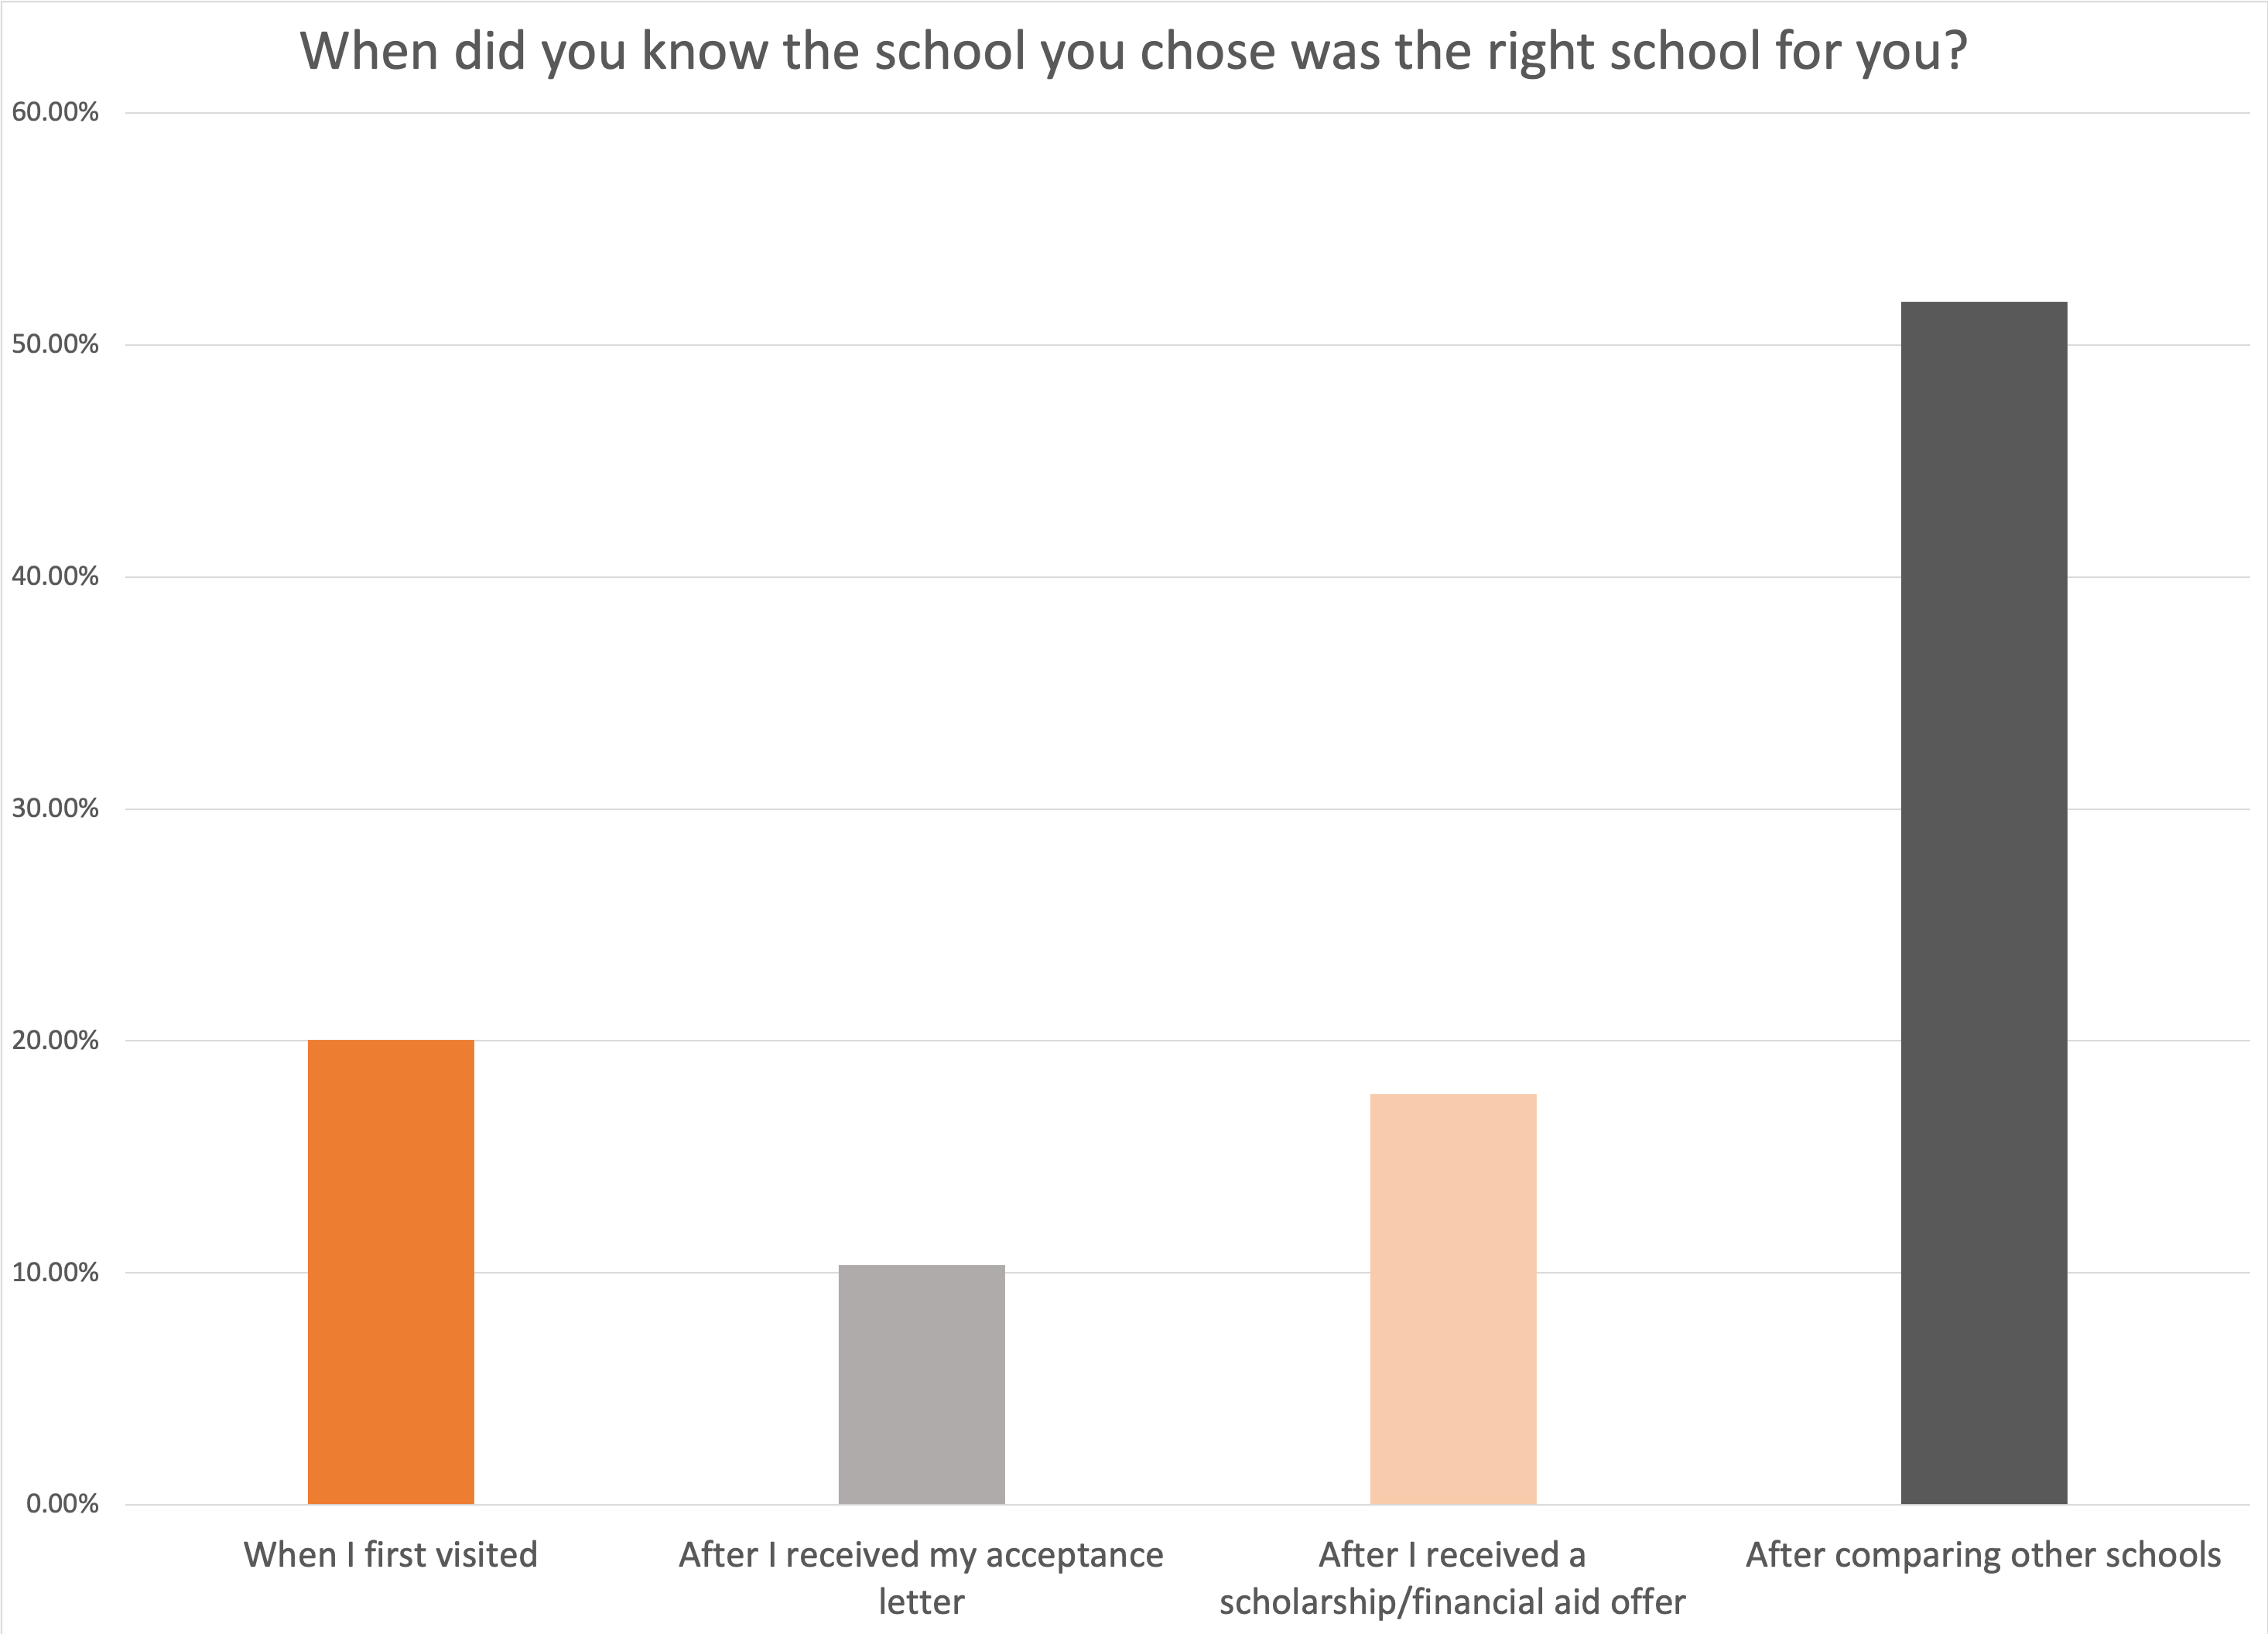
2. Knowing When a School Is “The Right School”
Over the years, we have made an effort to understand the emotional and informational decision path of a college-bound student. As part of our research, we have included questions like, “When did you know the school you chose was the right school for you?” Though the numbers have shifted slightly over time, campus visits and school comparisons have consistently risen to the top.
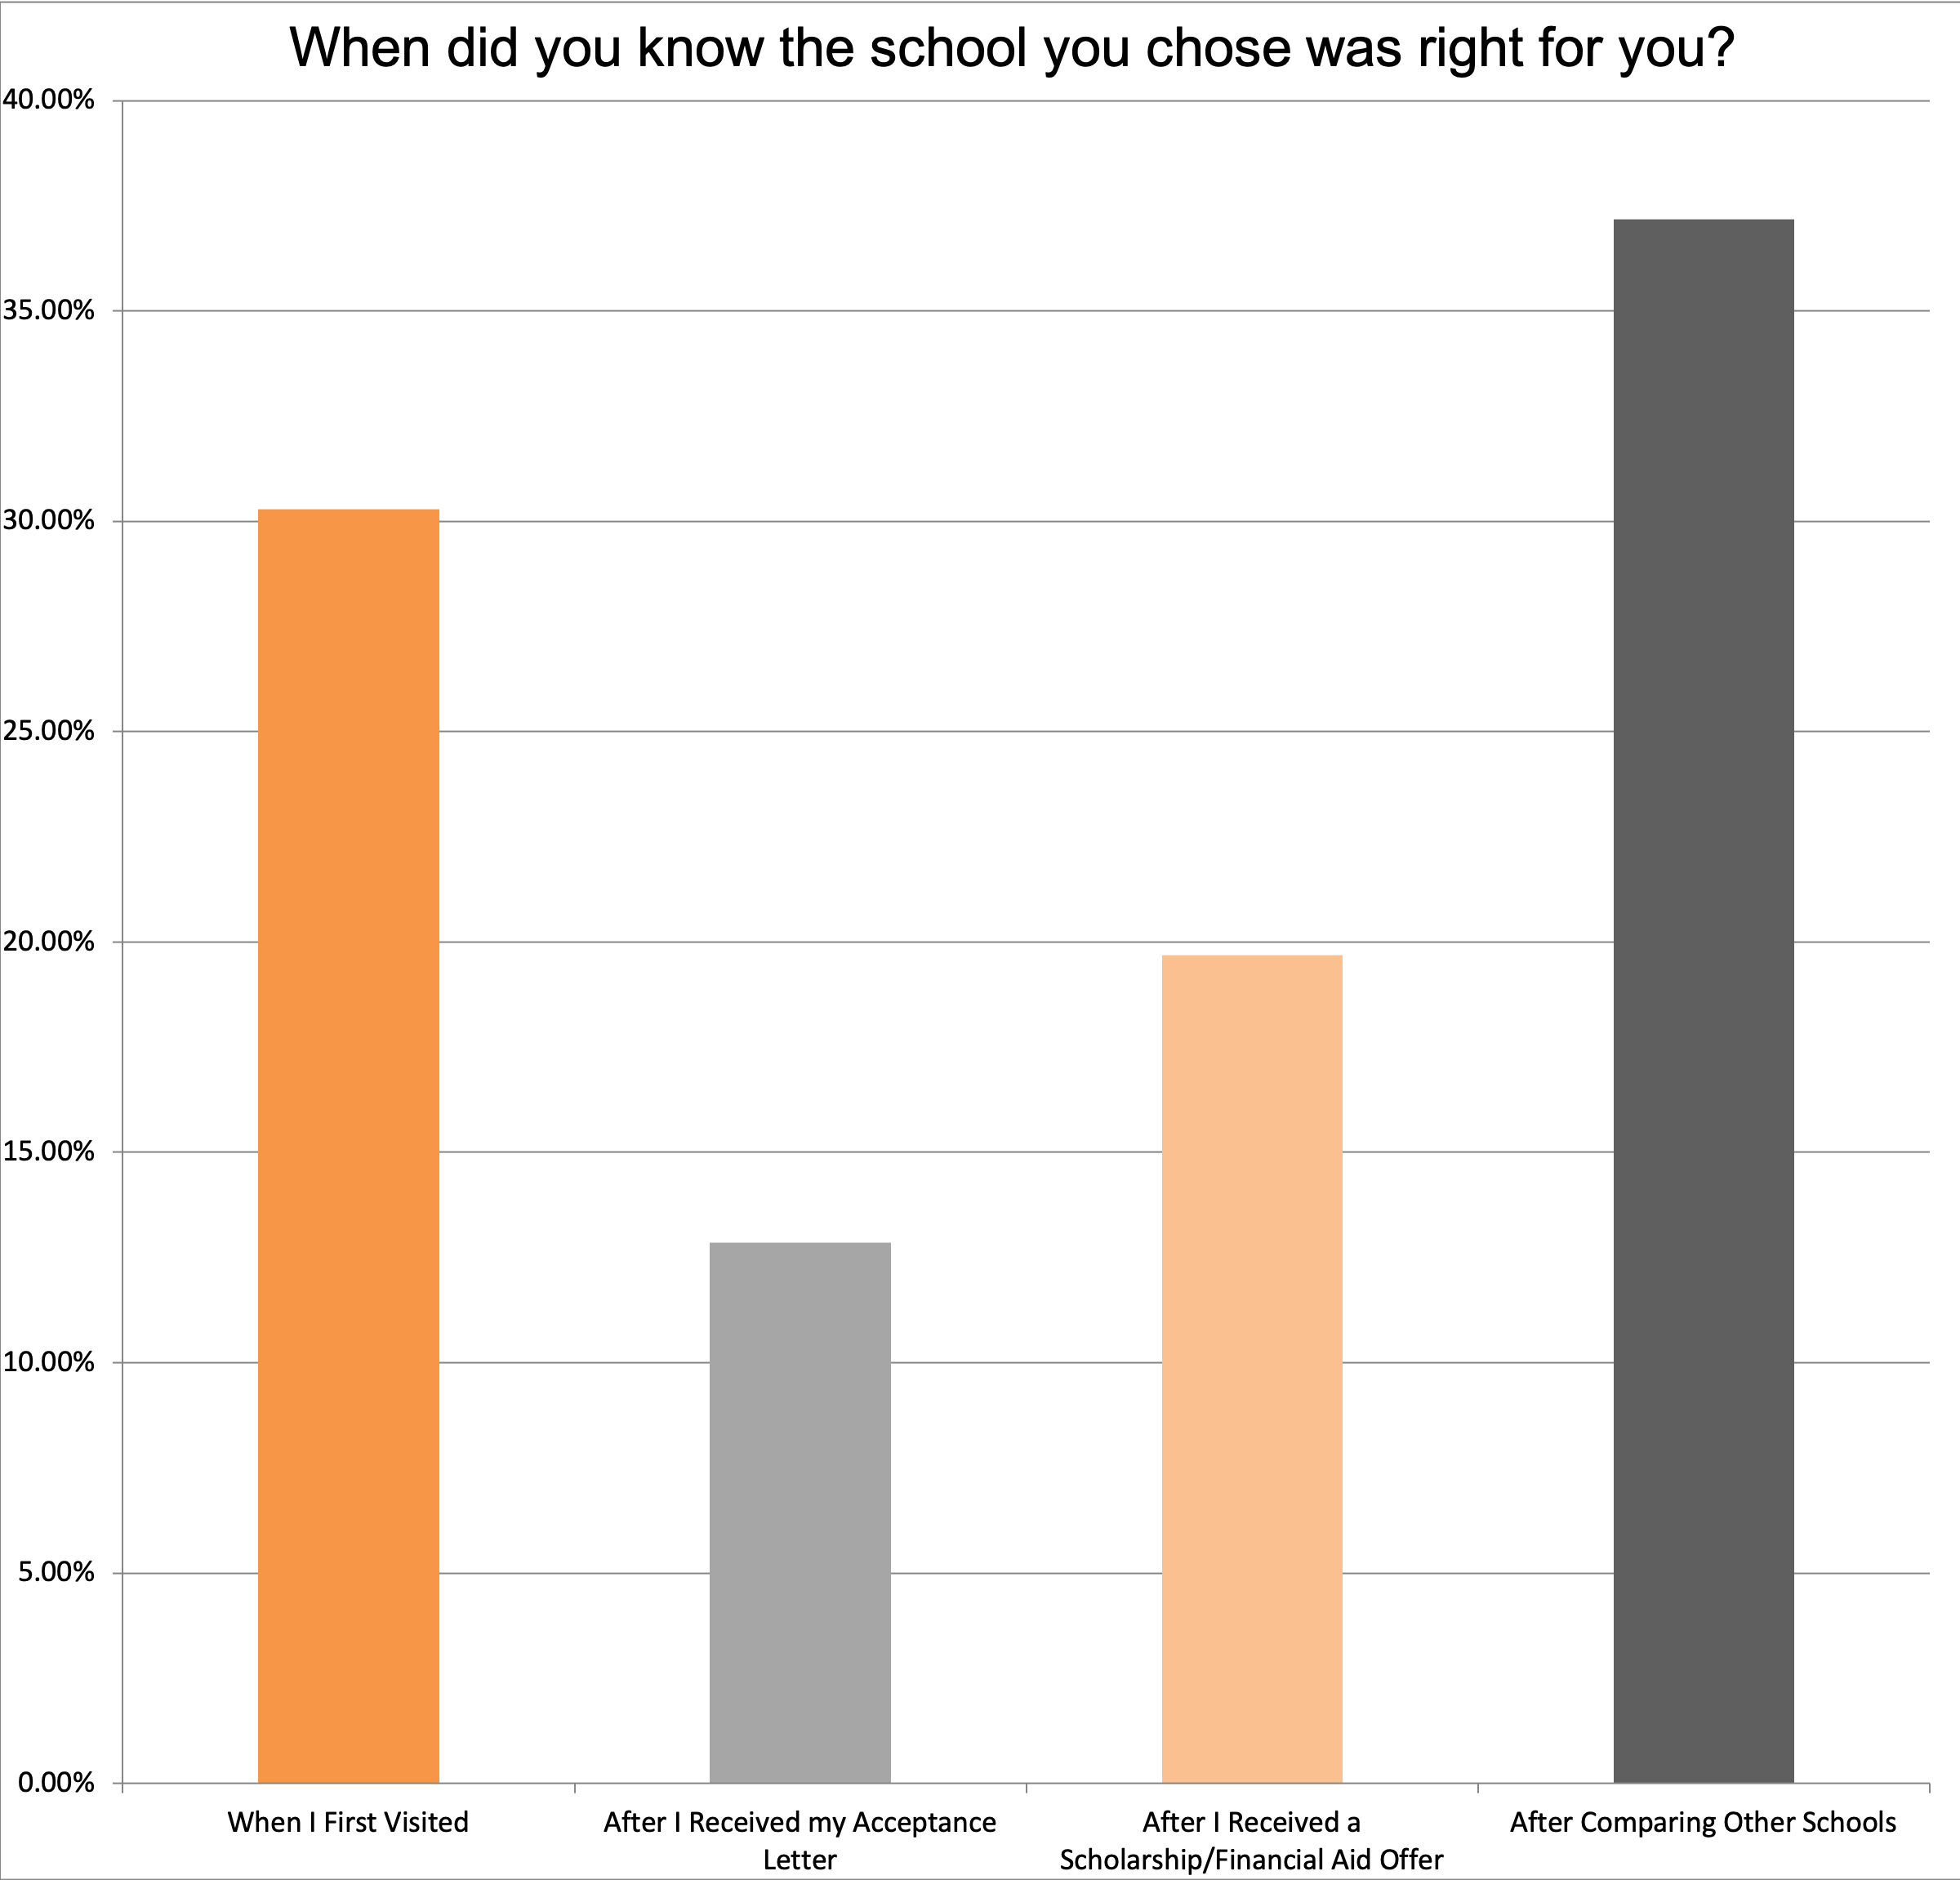
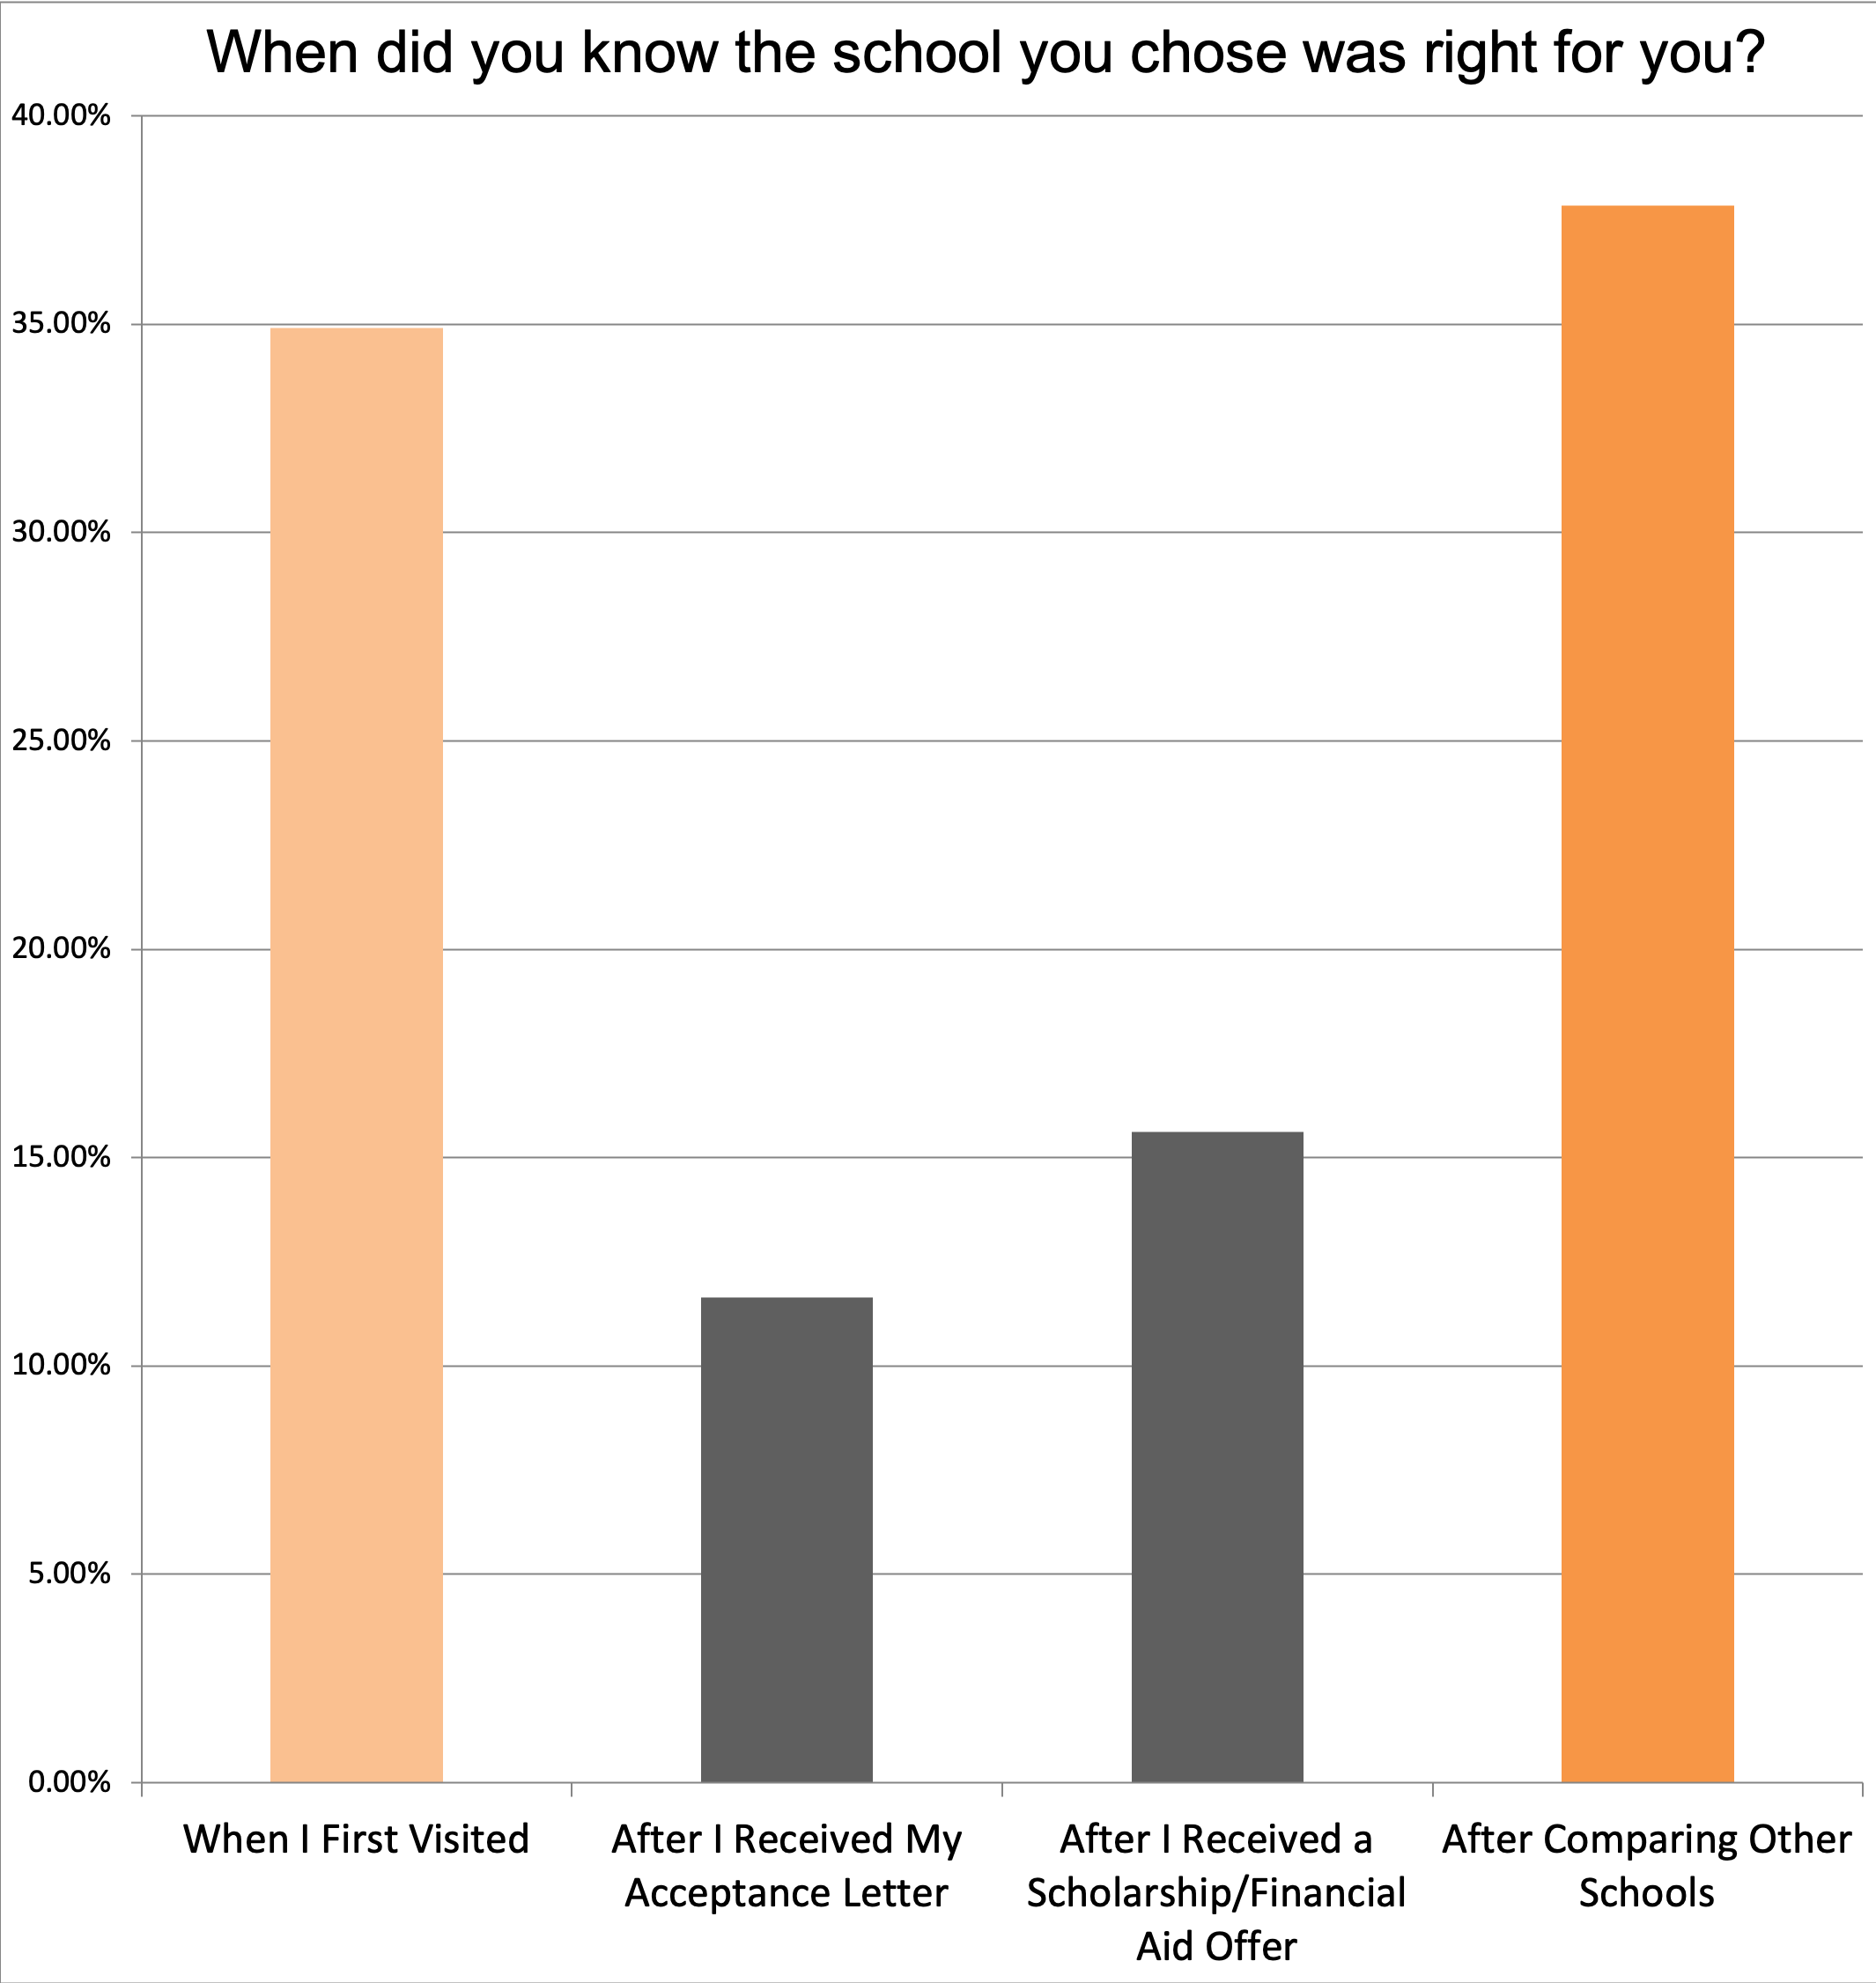
Click images to enlarge
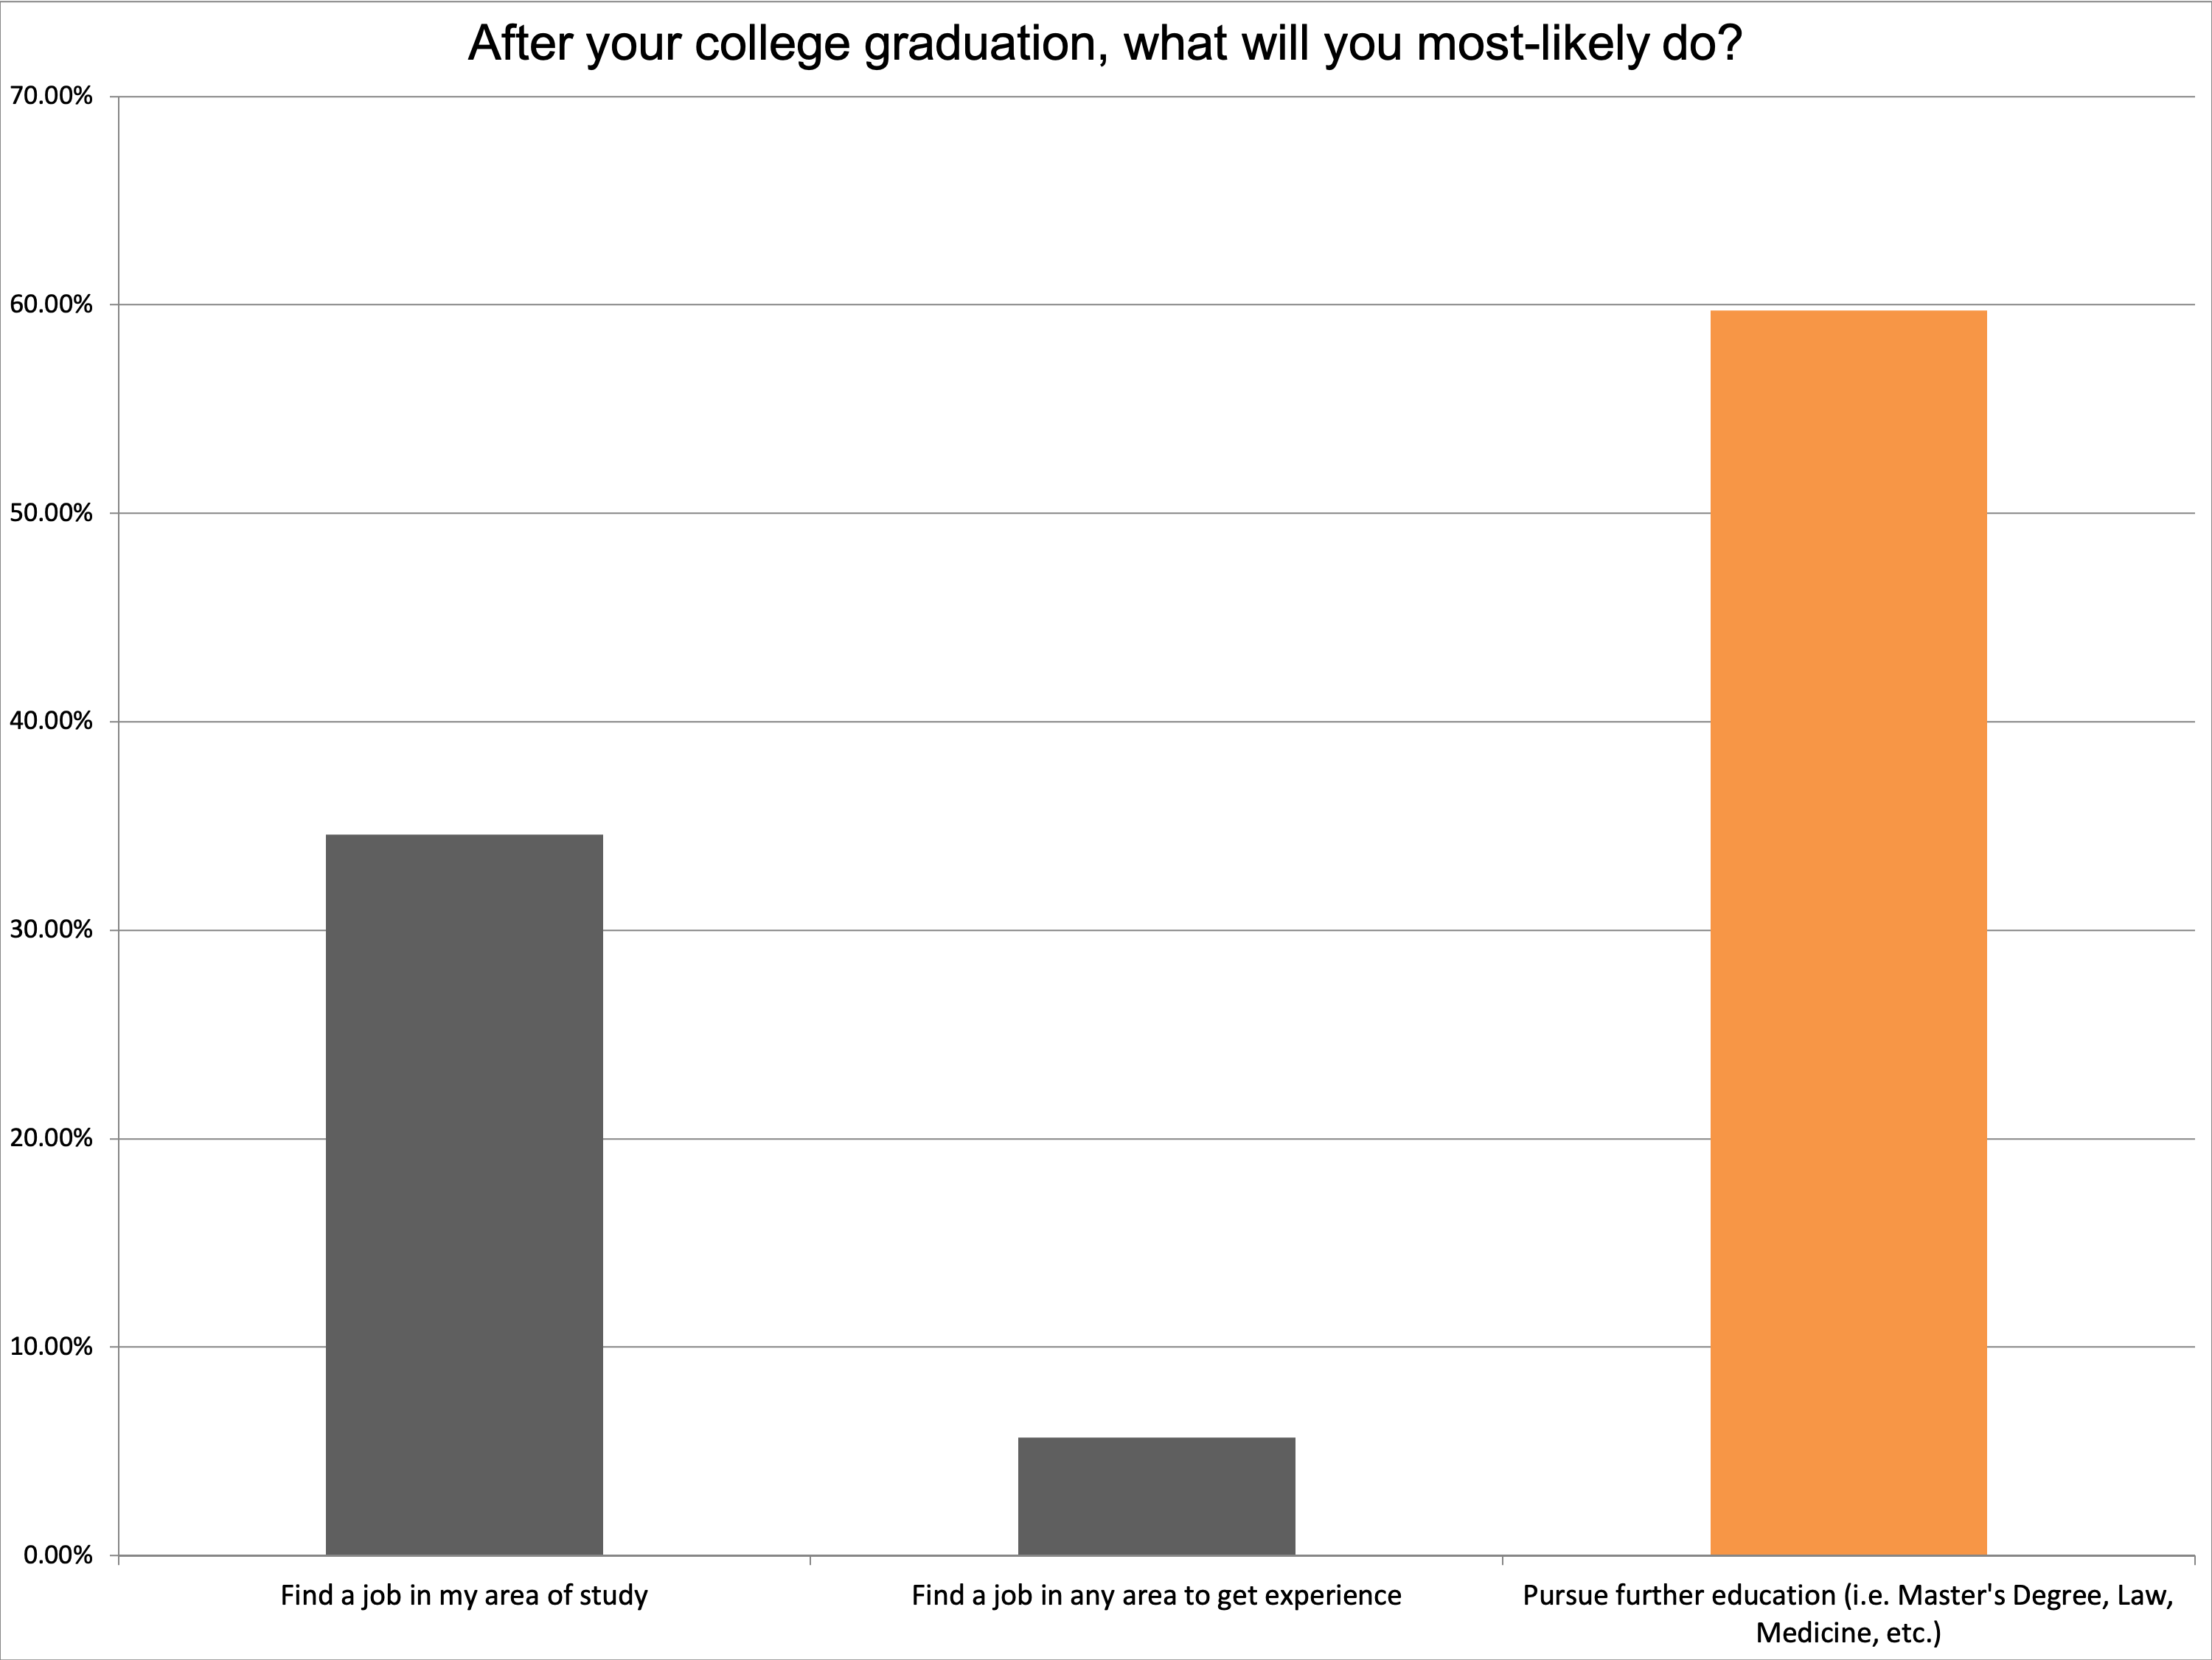
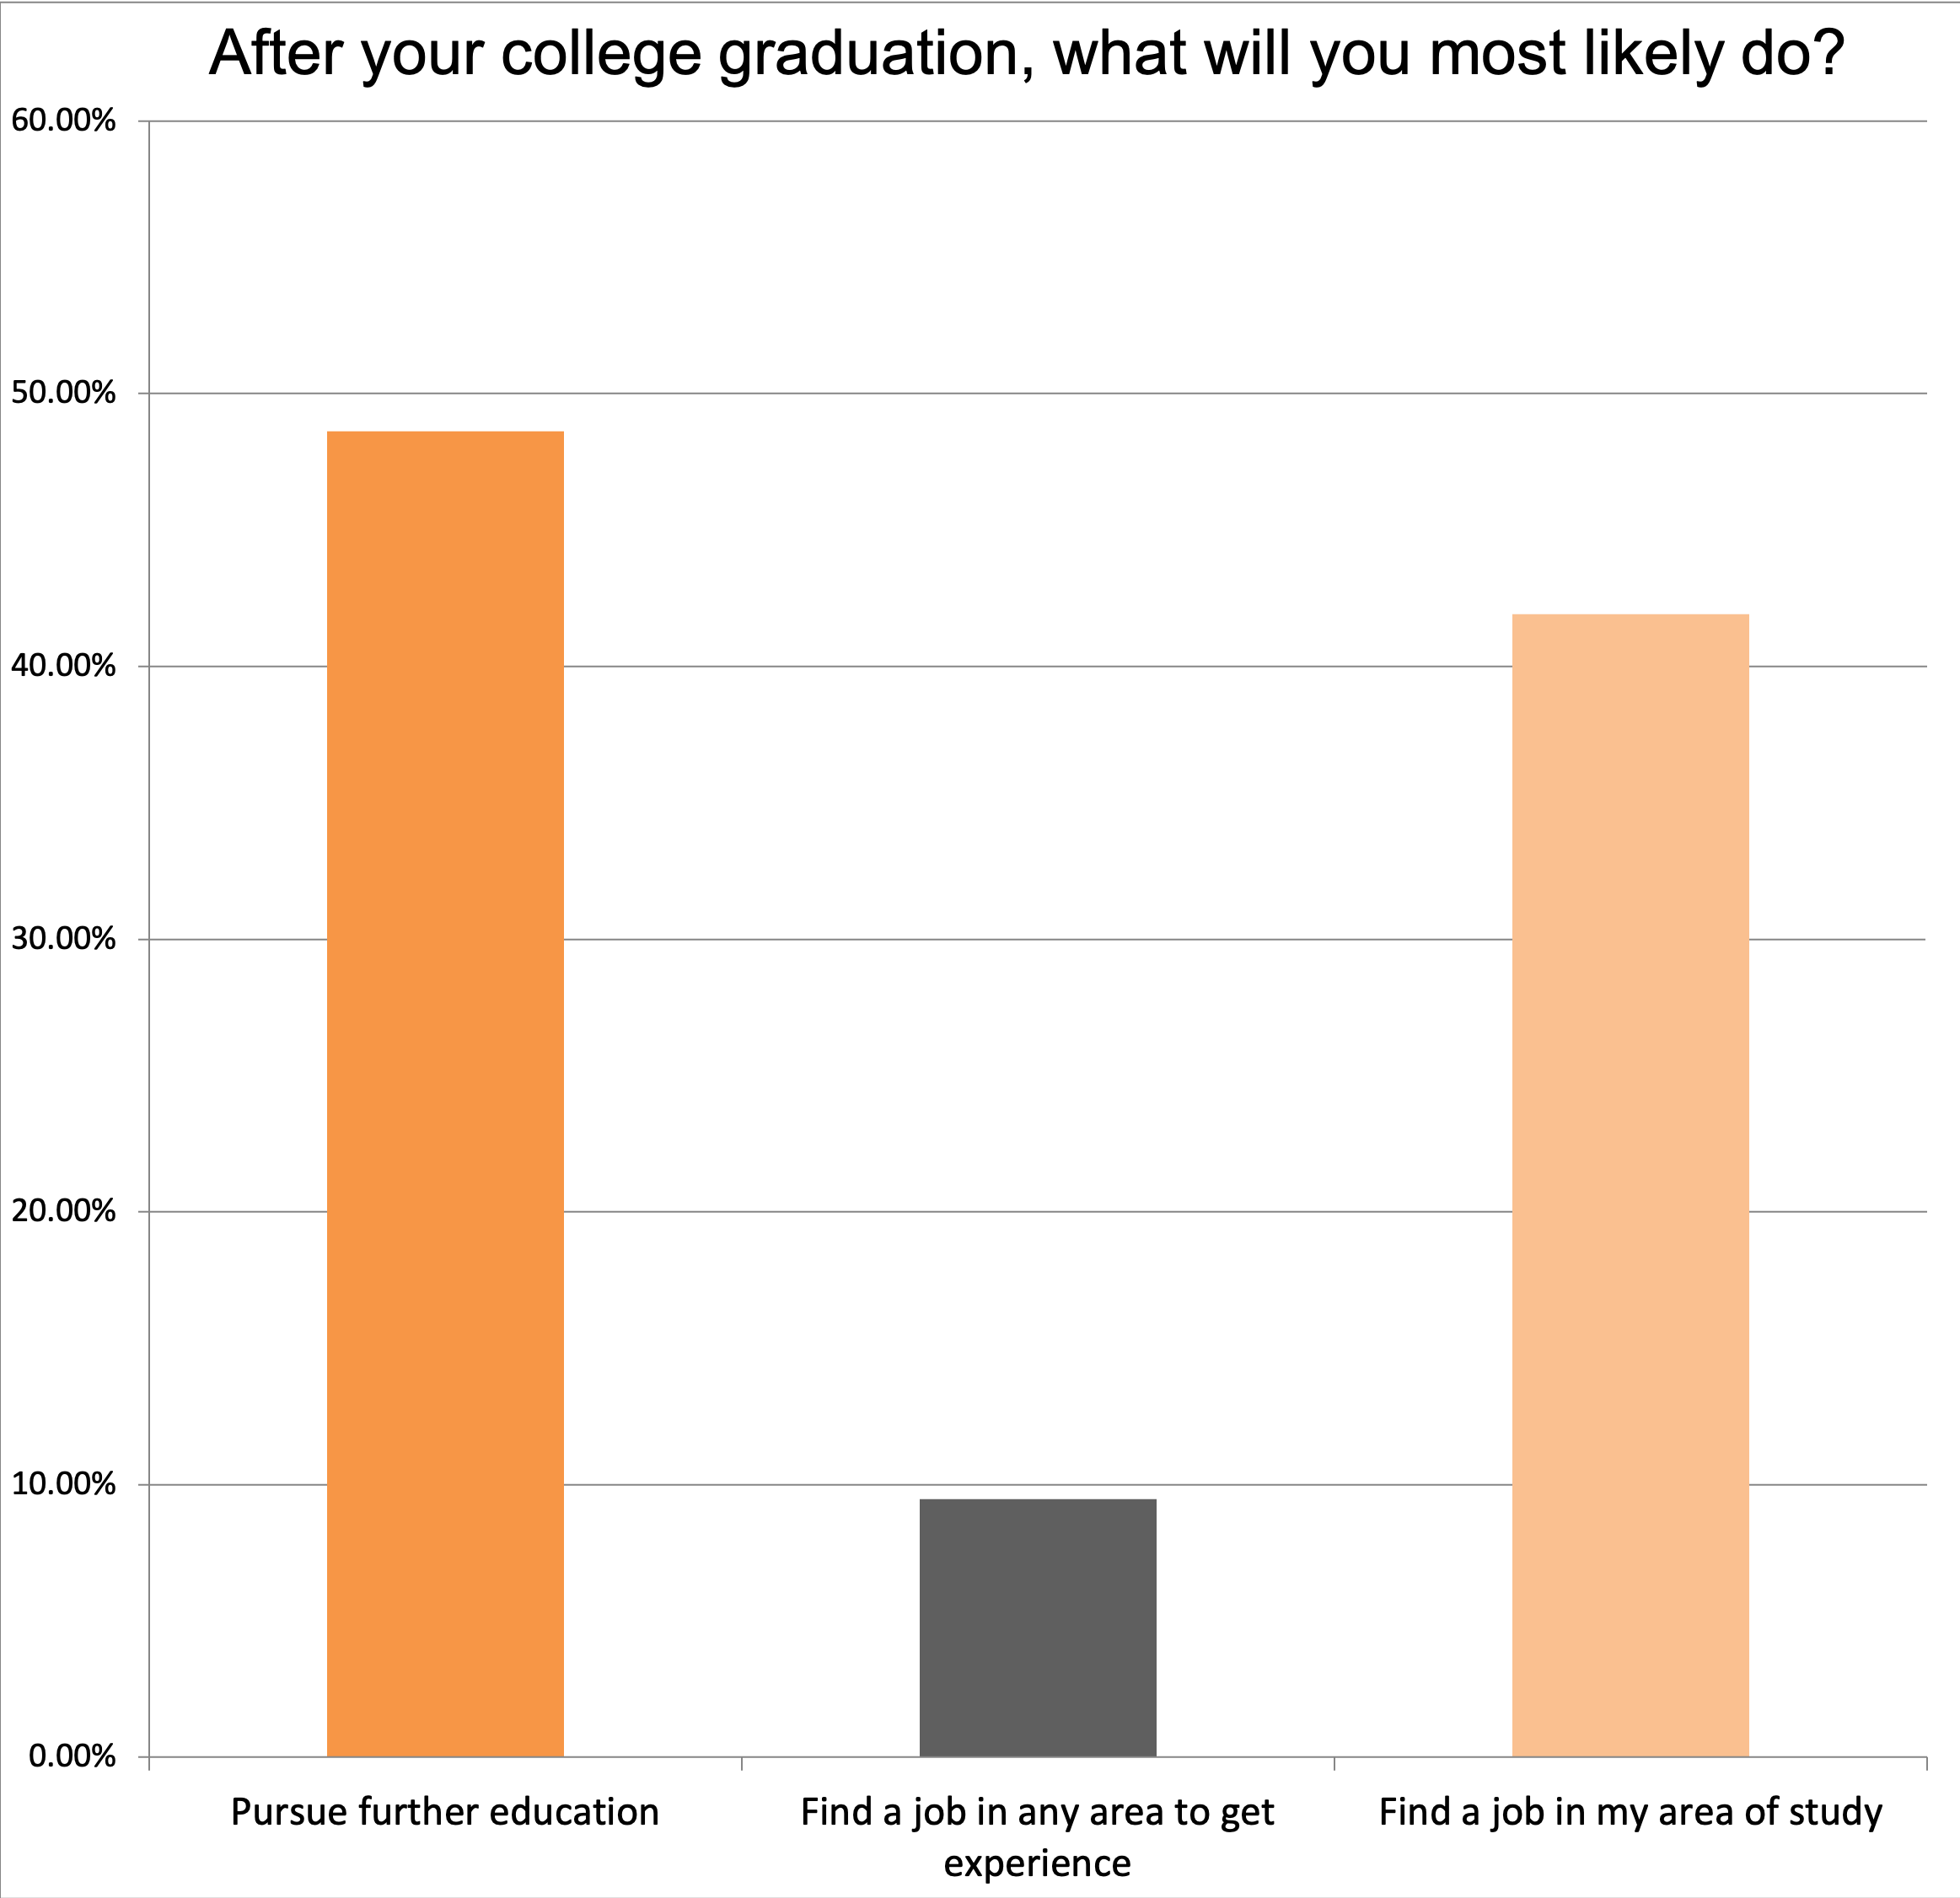
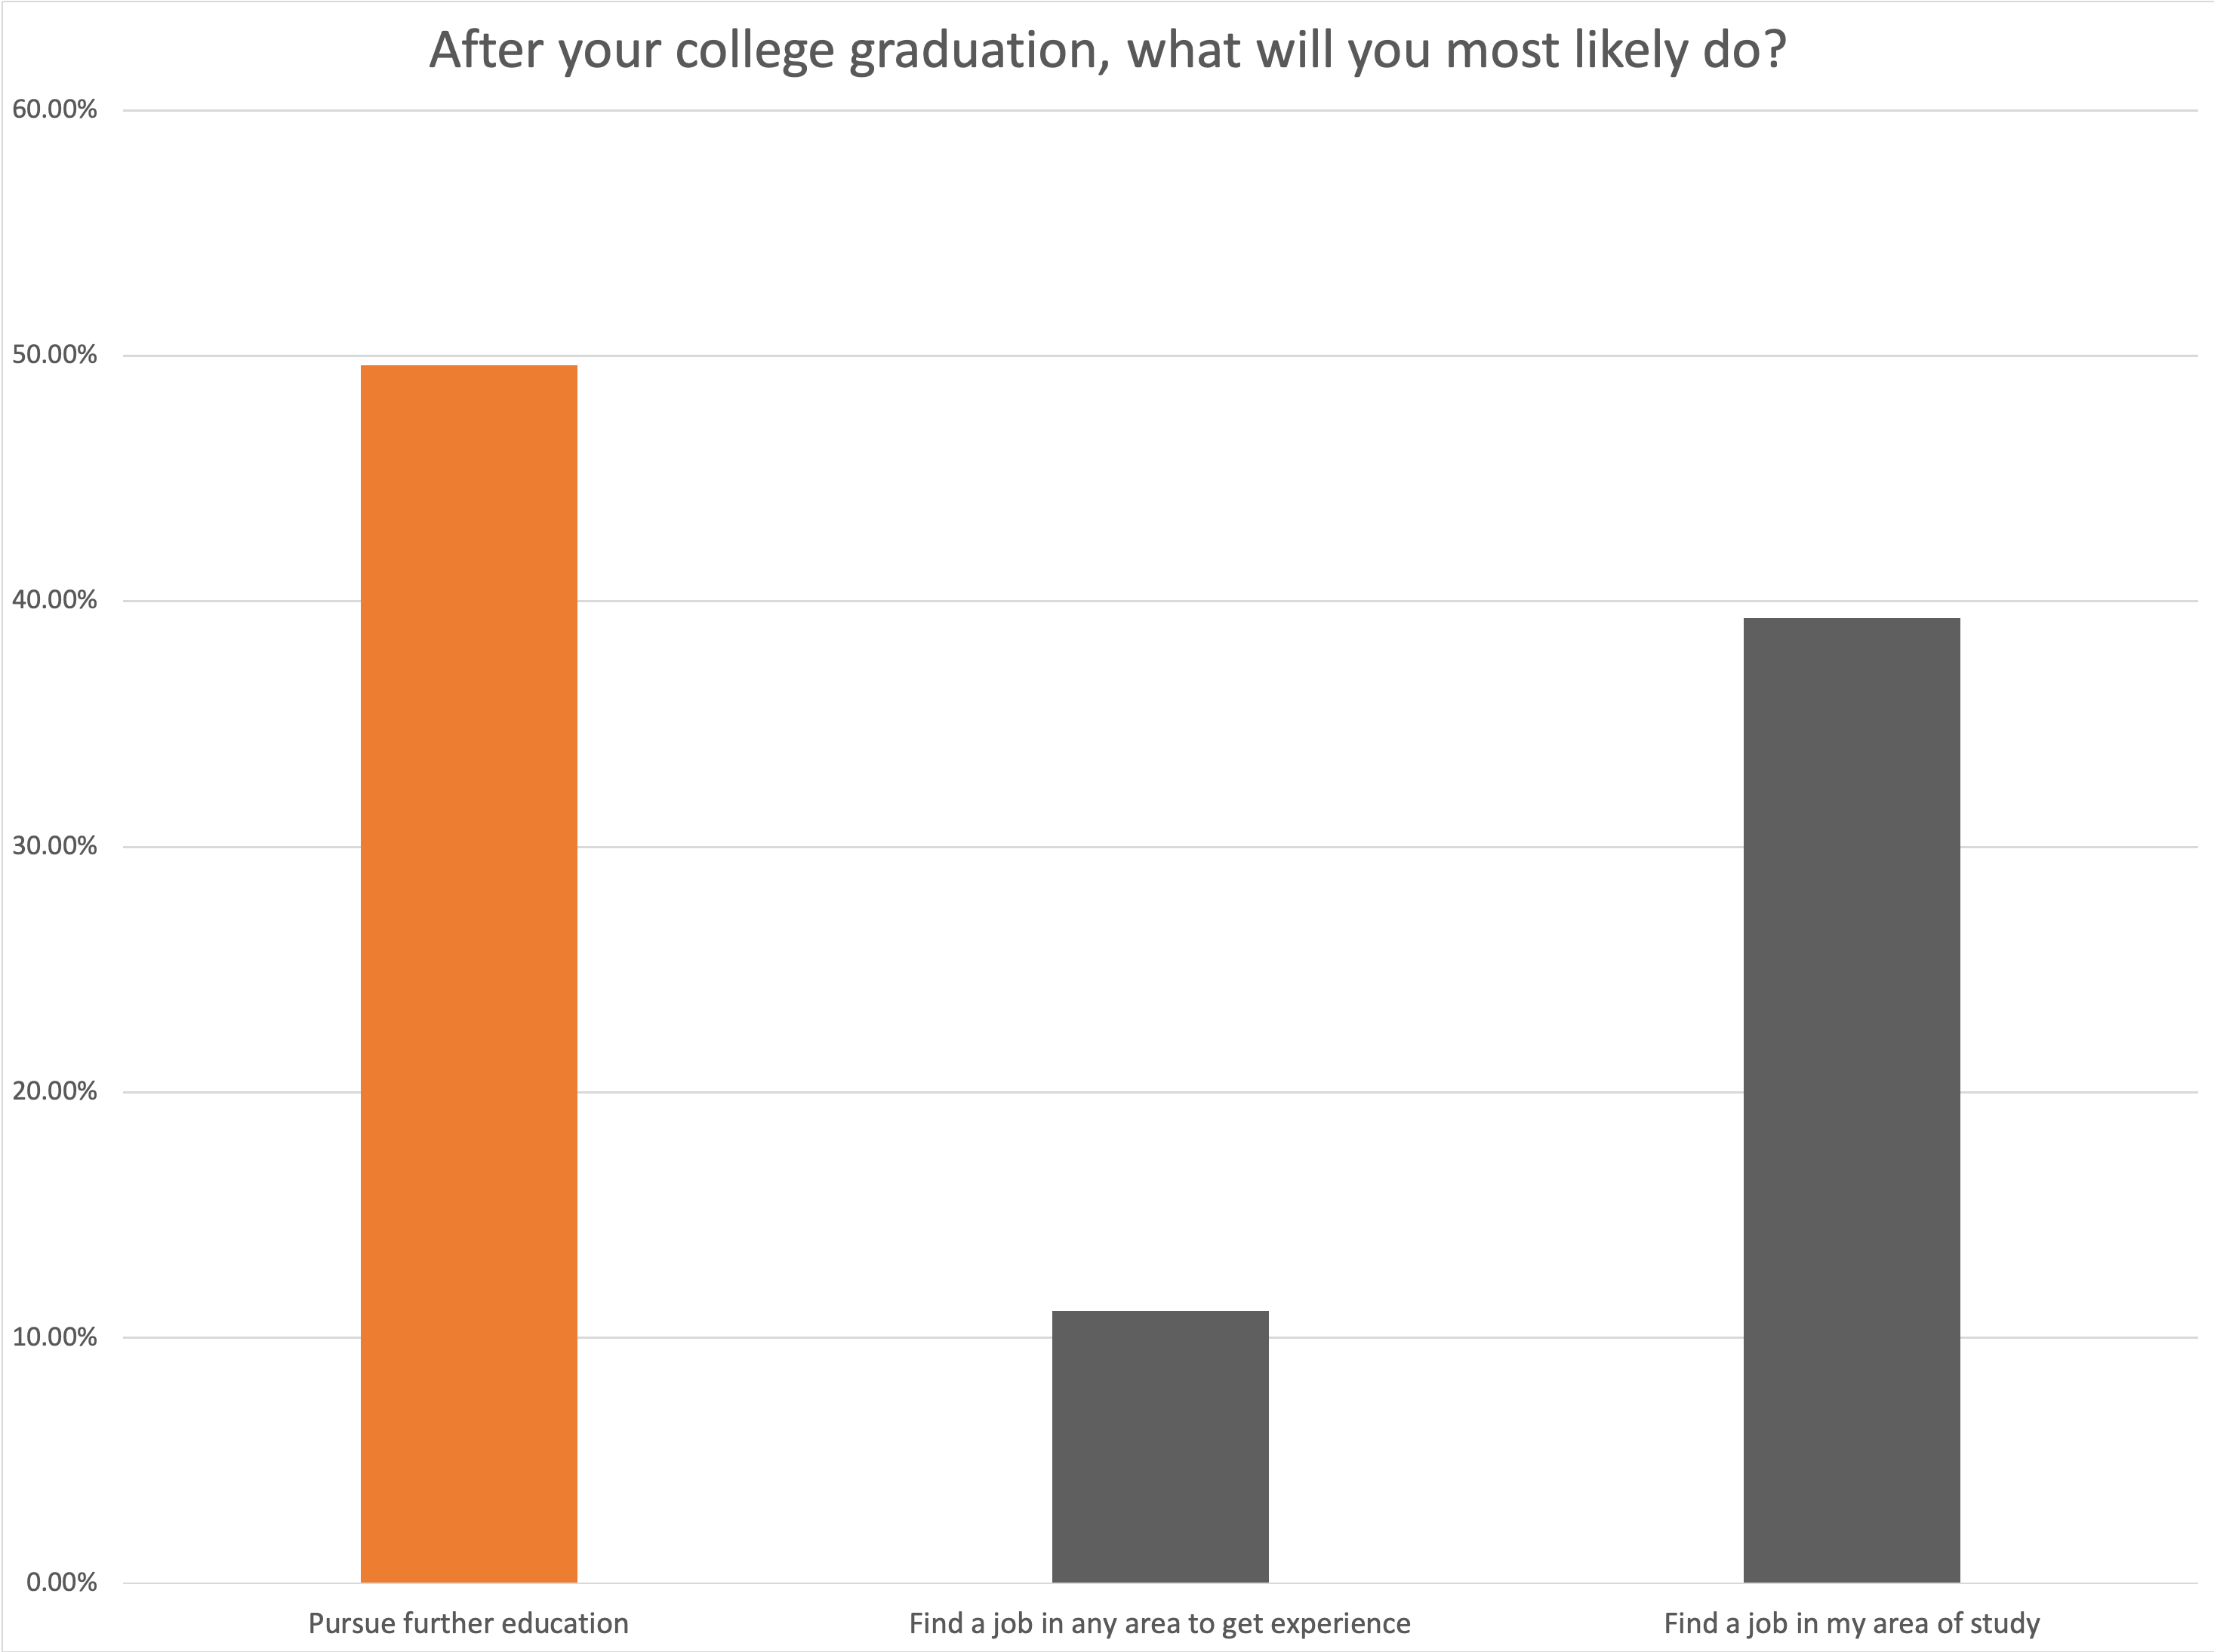
1. Expectations for Life After College Graduation
Over the past 10 years, we have asked upcoming first-year students about how they envision their future beyond college. The growing emphasis on being employed has certainly molded the mindset of the first-year college-bound student.
Click images to enlarge